Katch–McArdle BMR Calculator (Lean Body Mass / Body Fat %)
Katch–McArdle BMR Calculator
Estimate BMR using lean body mass (LBM) derived from your body fat percentage. If you don’t know your body fat %, use the main BMR calculator (Mifflin–St Jeor is a strong default).
On this page, the formula is locked to Katch–McArdle to keep results consistent. You can compare formulas on the main BMR calculator or our formula comparison page.
Your Details
Your Results
Assumptions & Warnings
📊 BMR vs Maintenance Comparison
🧾 Calculation Steps
📋 Detailed Breakdown
| Parameter | Value |
|---|---|
| Enter your details to see the breakdown. | |
🔧 Embed this calculator
Add this free standards-based calculator to your site — no signup required.
The embed code includes an iframe (height 1020px) and visible attribution to this page: calctypes.com/katch-mcardle-bmr-calculator/
Katch–McArdle Formula — Exact Equation, LBM Steps, and Source Notes
The exact Katch–McArdle equation
BMR = 370 + (21.6 × LBM in kg)
How to calculate lean body mass (LBM) from body fat %
LBM (kg) = weight (kg) × (1 − bodyFat% / 100)
For step-by-step measurement guidance, see our Lean Body Mass (LBM) calculator and guide.
“370 + 21.6 × lean body mass” — authoritative source
This equation is widely cited in exercise physiology and body composition–based energy estimation resources. The primary reference is McArdle WD, Katch FI, Katch VL — Exercise Physiology: Nutrition, Energy, and Human Performance. Different tools may label outputs as BMR or RMR; treat the result as a practical planning estimate rather than a laboratory measurement.
Katch–McArdle Worked Examples (LBM → BMR)
Examples use the same math shown in the Calculation Steps section above. If you want to do it by hand, see how to calculate BMR manually.
Example 1: 80 kg at 20% body fat
LBM = 80 × (1 − 0.20) = 64 kg
BMR = 370 + (21.6 × 64) = 370 + 1382.4 ≈ 1,752 kcal/day
Example 2: 65 kg at 28% body fat
LBM = 65 × (1 − 0.28) = 46.8 kg
BMR = 370 + (21.6 × 46.8) = 370 + 1010.9 ≈ 1,381 kcal/day
Example 3: Why body fat % accuracy matters
If the same person (80 kg) is estimated at 18% vs 22% body fat, LBM changes from 65.6 kg to 62.4 kg. Because the formula multiplies LBM by 21.6, that 3.2 kg LBM difference shifts BMR by ~69 kcal/day.
If you don’t trust your body fat % number, compare against Mifflin–St Jeor on the main BMR calculator.
How Accurate Is Katch–McArdle?
Katch–McArdle can be useful when body fat % is reasonably accurate because it estimates resting energy needs using lean body mass rather than total body weight. But it’s still an equation-based estimate — individual results can differ due to biology, measurement error, sleep/stress, medications, and health conditions.
- Biggest sensitivity: body fat % accuracy (because it directly changes LBM).
- Best use case: a consistent baseline that you adjust based on multi-week trends.
- Direct measurement: indirect calorimetry is the more direct lab method for true energy expenditure.
Limitations (Important)
- Estimate only: may differ substantially from lab testing.
- Body fat % uncertainty: errors in BF% propagate directly into LBM and BMR.
- Not designed for all cases: teens, pregnancy/lactation, elite athletes, and many medical conditions may not fit “average” population assumptions.
- Not medical advice: not for diagnosis, treatment, or compliance decisions.
Full policy: CalcTypes Disclaimer.
Methodology — How This Page Calculates
This page calculates BMR using the Katch–McArdle equation and optionally estimates maintenance calories using an activity multiplier. Results are shown in kcal/day and converted to kJ/day.
- LBM calculation: weight × (1 − bodyFat%/100)
- Katch–McArdle: 370 + 21.6 × LBM(kg)
- Maintenance: BMR × activity multiplier (PAL factor)
- kJ conversion: kcal × 4.184
- Rounding: to nearest whole kcal/kJ for readability
Questions People Ask — Katch–McArdle
Detailed, lecture-style answers for common search queries, calculation confusion points, and practical planning decisions. Each answer is written to be genuinely useful — not just a one-liner.
What is the Katch–McArdle BMR formula?
The Katch–McArdle equation estimates Basal Metabolic Rate (BMR) — the number of kilocalories your body needs at complete rest — using a single input: your lean body mass (LBM) in kilograms.
BMR = 370 + (21.6 × LBM in kg)
Before you can use this equation, you must first calculate LBM from your total body weight and body fat percentage:
LBM (kg) = Total Body Weight (kg) × (1 − Body Fat% ÷ 100)
For example: a person weighing 80 kg at 20% body fat has an LBM of 80 × (1 − 0.20) = 64 kg. Plugging that into the equation: 370 + (21.6 × 64) = 370 + 1382.4 = 1,752 kcal/day.
Why lean body mass? The logic behind using LBM rather than total body weight is that metabolically active tissue — muscle, organs, bone — drives resting energy expenditure. Adipose (fat) tissue is metabolically far less active per kilogram. Two people with the same total weight but different body compositions will have meaningfully different resting calorie needs. By factoring out fat mass, the Katch–McArdle equation aims to capture that difference.
What the constants mean: The intercept (370) represents a baseline calorie floor — energy required by organs and basic physiological processes that isn’t purely explained by lean mass. The coefficient (21.6) represents the estimated kilocalories per kilogram of lean body mass per day. These values were derived from regression analysis on a measured population sample and are not universal constants of nature — they are averages that fit a curve to real data.
Both kcal/day and kJ/day are valid output units. This calculator shows both. Conversion: 1 kcal = 4.184 kJ.
What is the authoritative source for “370 + 21.6 × lean body mass”?
The Katch–McArdle equation is most commonly attributed to the textbook Exercise Physiology: Nutrition, Energy, and Human Performance by William D. McArdle, Frank I. Katch, and Victor L. Katch (published by Wolters Kluwer / Lippincott Williams & Wilkins, now in its eighth edition). This textbook is a widely used reference in exercise science, kinesiology, and sports nutrition curricula.
A note on terminology and attribution: Unlike some BMR equations (e.g., Mifflin–St Jeor or Harris–Benedict, which are tied to specific peer-reviewed journal publications with easily citable PMID numbers), the Katch–McArdle equation is primarily cited through the textbook rather than a single original research paper. This means the “authoritative source” is fundamentally a textbook reference — which is entirely legitimate in exercise physiology — but it also means you will encounter variation in how different tools and resources attribute it.
Why you see “BMR” and “RMR” used interchangeably: The textbook itself and many derivative resources use both terms in different editions and contexts. For practical planning purposes, the distinction rarely matters — both refer to resting energy expenditure under reasonably rested conditions. See BMR vs RMR for a deeper explanation of the difference difference.
Practical implication: Because the equation comes from textbook regression data rather than a large-scale independent validation study, it carries inherent uncertainty when applied to individuals. The same is true of all predictive BMR equations — they are population-level models applied to individuals, and individual variation is real and sometimes substantial (commonly ±10–15% vs. indirect calorimetry in healthy adults).
If you are citing this equation for academic or clinical purposes, reference: McArdle WD, Katch FI, Katch VL — Exercise Physiology: Nutrition, Energy, and Human Performance (Wolters Kluwer). Check the edition used by your institution or program.
Does Katch–McArdle estimate BMR or RMR — and does the difference matter?
This is one of the most common points of confusion in metabolic rate estimation, and it’s worth unpacking properly.
Basal Metabolic Rate (BMR) is technically defined as energy expenditure measured under the most stringent conditions possible: the subject must be completely at rest (supine), in a thermoneutral environment, in a post-absorptive state (typically 12+ hours fasted), mentally calm, and having had no physical activity the previous day. BMR is a laboratory measurement — it is not something you can meaningfully measure at home.
Resting Metabolic Rate (RMR) — sometimes called Resting Energy Expenditure (REE) — is measured under less strict conditions. A typical RMR protocol requires 4–6 hours fasted, 30 minutes of quiet rest before measurement, and no intense exercise the previous day. Because the conditions are less extreme, RMR is slightly higher than true BMR — the difference is usually in the range of 3–10% depending on the individual and protocol.
What Katch–McArdle actually estimates: In practice, virtually all predictive equations — including Katch–McArdle, Mifflin–St Jeor, and Harris–Benedict — are derived from regression against indirect calorimetry data collected under conditions closer to RMR than true BMR. Despite this, most online calculators label the output “BMR.” The label is conventional shorthand, not a precise technical claim.
Does the BMR/RMR distinction matter for planning? For most people using these calculators to estimate maintenance calories or a starting point for a diet, the answer is: not really. The BMR/RMR difference (3–10%) is smaller than the inherent equation error vs. actual measured values (commonly ±10–15%). The activity multiplier you apply on top is a much larger source of error and variability. Focus your attention there.
If you need a precise metabolic rate for clinical or research purposes, indirect calorimetry (measuring oxygen consumption and carbon dioxide production) is the appropriate method — not a predictive equation.
Can I use Katch–McArdle without knowing my body fat %?
No — not effectively, and here is why that matters more than it might seem.
The entire premise of Katch–McArdle is that lean body mass is a better predictor of resting energy expenditure than total body weight. But to calculate LBM, you must first know body fat percentage. If you don’t have that number, the equation has no inputs to work with.
What happens if you guess? Consider someone who weighs 80 kg. If body fat % is estimated at 15% instead of the actual 25%, LBM changes from 60 kg to 68 kg — a difference of 8 kg of lean mass. That 8 kg difference, multiplied by 21.6 in the formula, produces a BMR difference of approximately 173 kcal/day. That is not a small error for calorie planning.
What to do instead: If you don’t have a body fat % estimate, use the Mifflin–St Jeor formula on the main BMR calculator. Mifflin–St Jeor uses age, sex, height, and weight — inputs most people know accurately — and has been independently validated as the most accurate predictive equation for the general population in multiple studies.
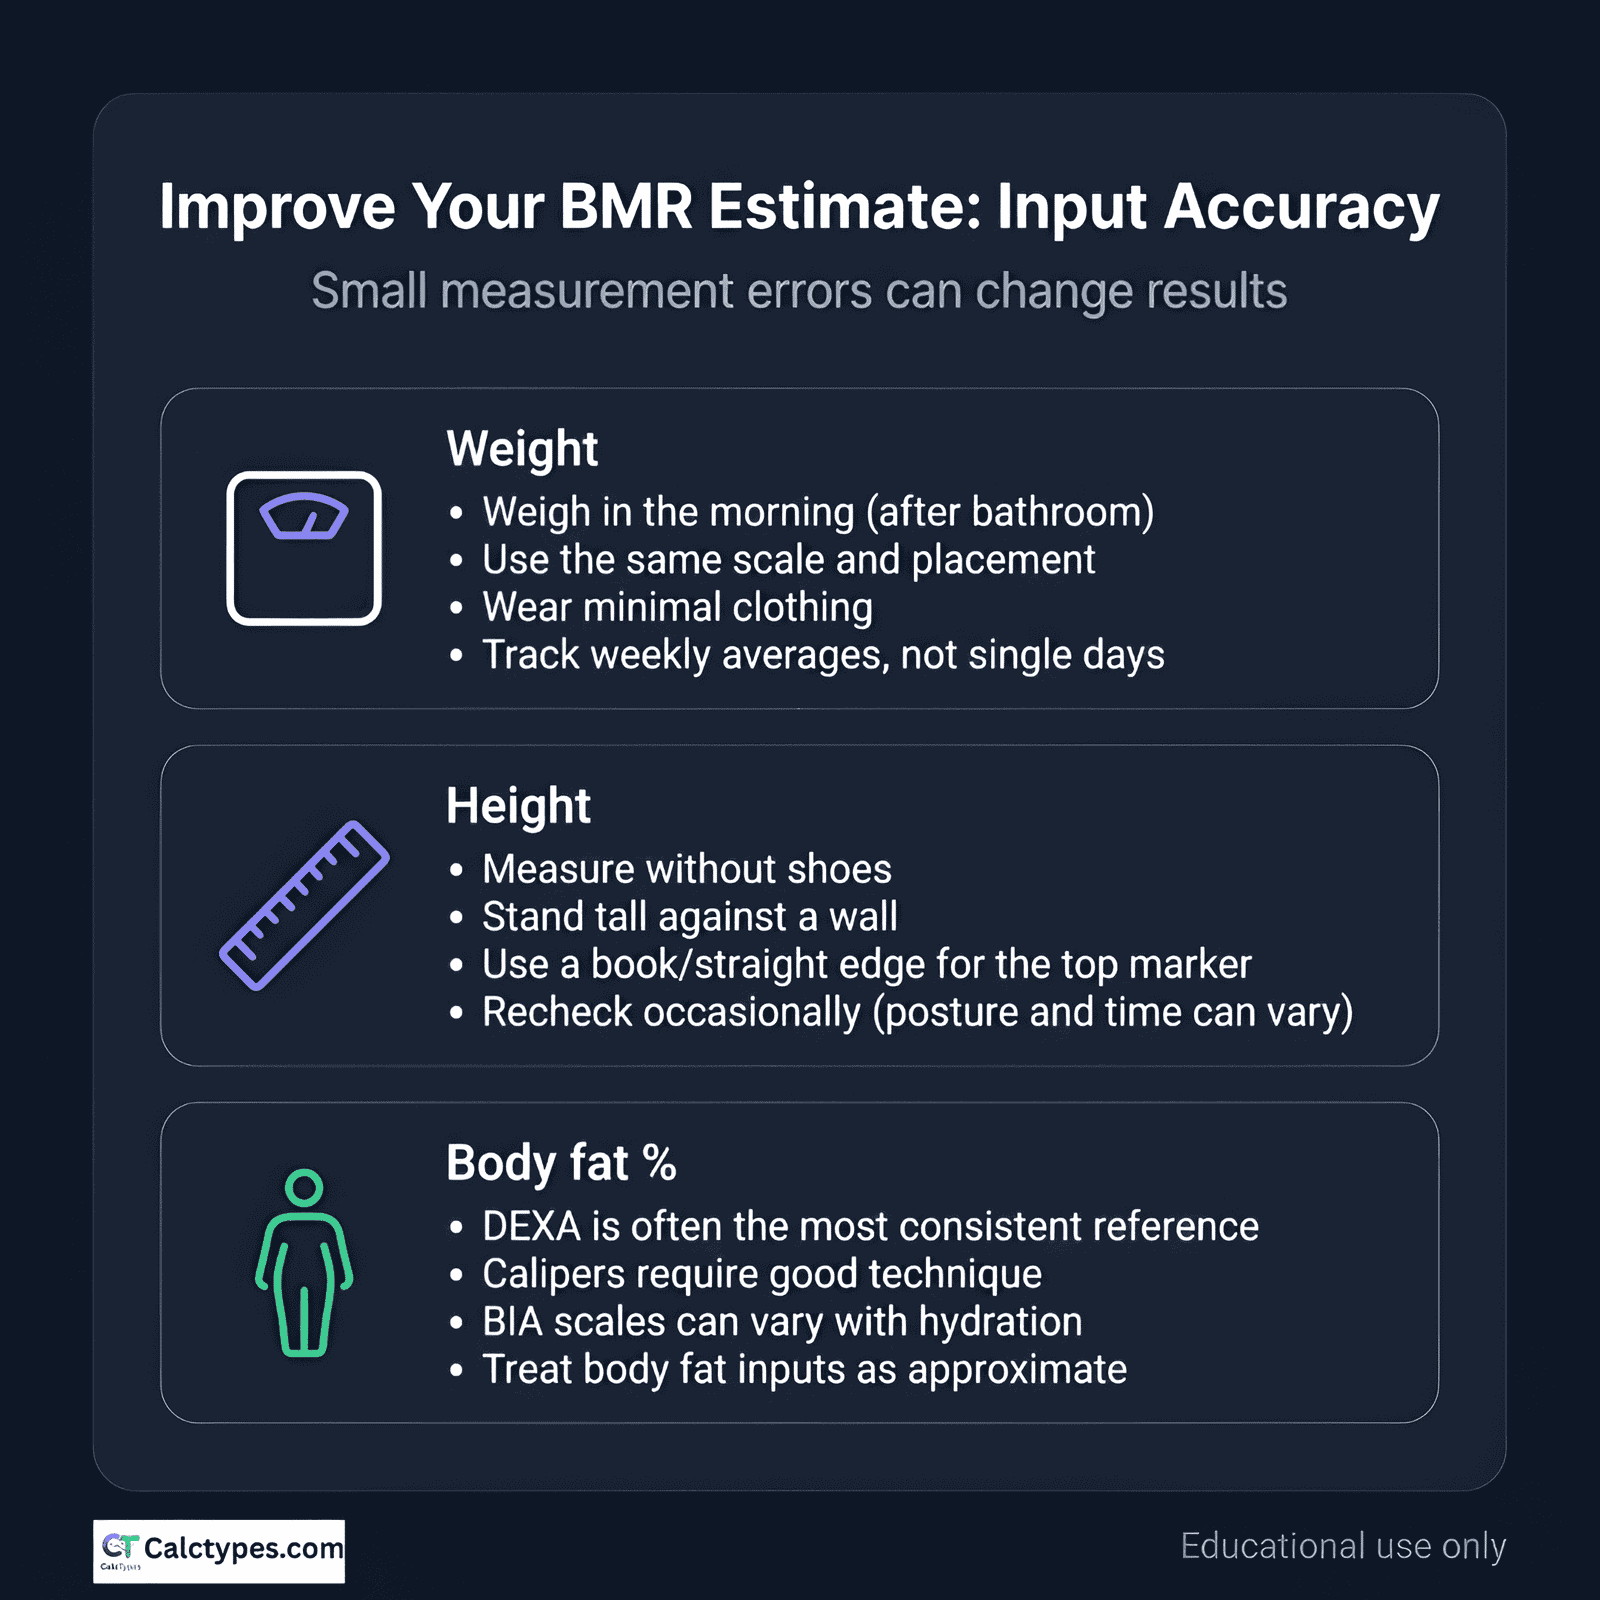
What counts as a “usable” body fat % estimate? You don’t need perfect precision — you need reasonable accuracy and consistency:
- DEXA scan: the most accurate widely accessible method. Gives a precise, reproducible body composition breakdown. Worth doing once if you are serious about tracking.
- Bioelectrical impedance analysis (BIA): widely available (smart scales, handheld devices). Accurate enough for tracking trends if conditions are controlled (same time of day, same hydration state, same device). Single readings vary significantly with hydration.
- Skinfold calipers: accurate if performed by a trained technician using a validated protocol (Jackson–Pollock, Durnin–Womersley). Self-measurement is inconsistent.
- Visual estimates / Navy method: low accuracy, high individual error. Not recommended as a basis for Katch–McArdle calculations.
Our Lean Body Mass guide covers measurement methods in more detail.
How do I go from Katch–McArdle BMR to maintenance calories (TDEE)?
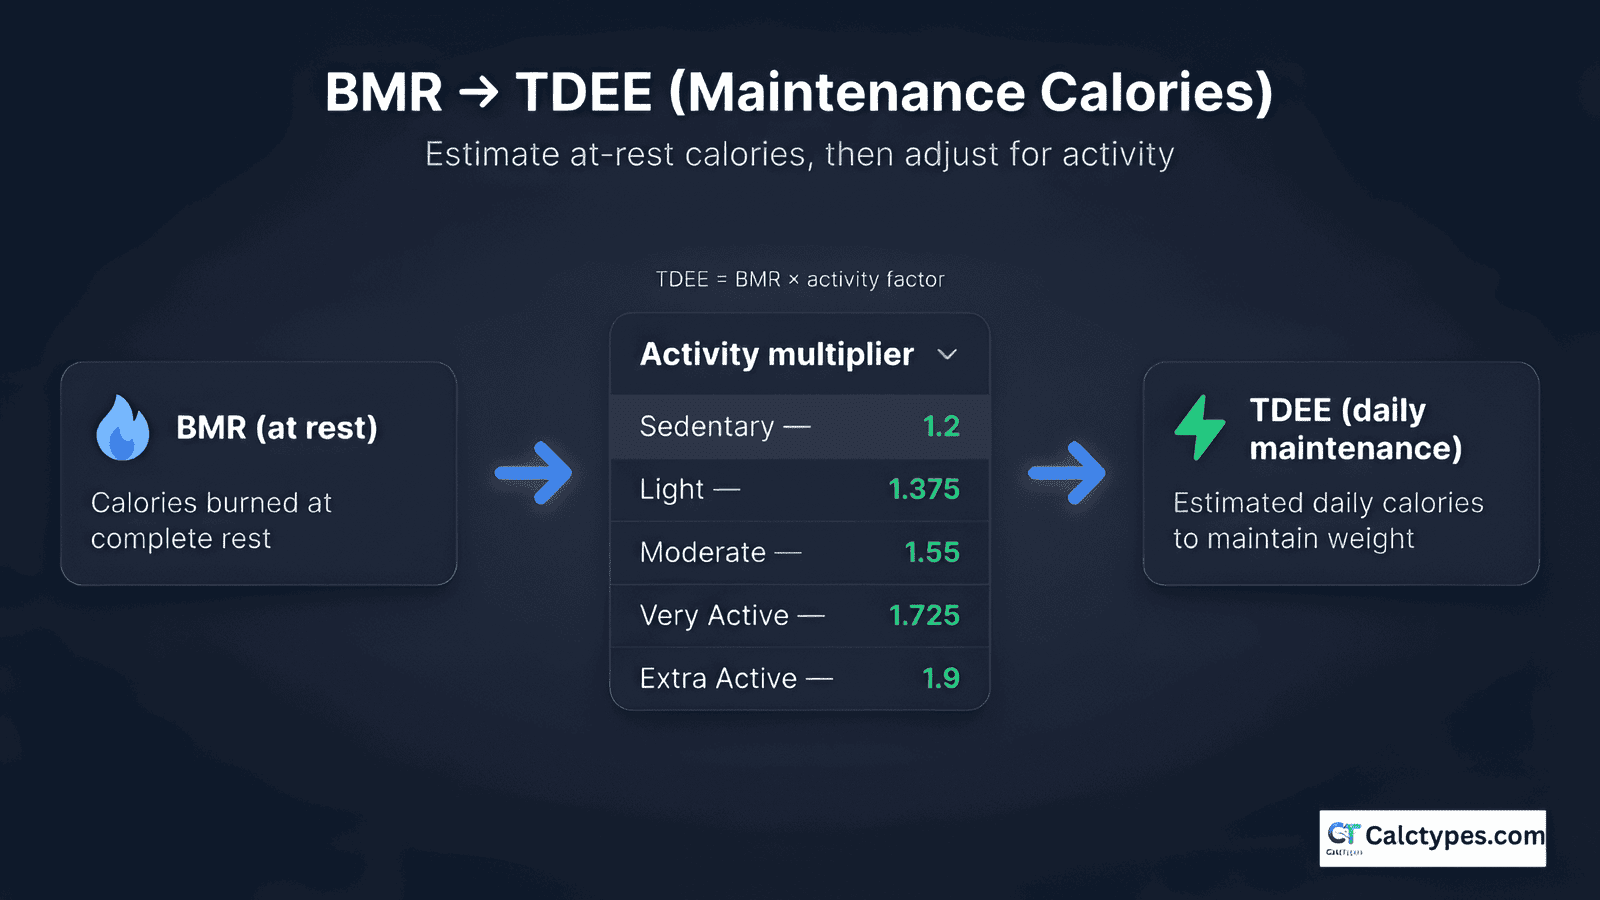
Your BMR is the energy your body uses at complete rest. But you are not at complete rest all day — you move, digest food, exercise, and go about your life. To estimate how many calories your body actually needs on a typical day (your Total Daily Energy Expenditure, or TDEE), you multiply your BMR by a Physical Activity Level (PAL) multiplier.
Maintenance Calories = BMR × Activity Multiplier
The standard multipliers used in this calculator:
| Activity Level | Multiplier | Who it fits |
|---|---|---|
| Sedentary | × 1.2 | Desk job, little or no structured exercise |
| Lightly Active | × 1.375 | Light exercise or sport 1–3 days/week |
| Moderately Active | × 1.55 | Moderate exercise or sport 3–5 days/week |
| Very Active | × 1.725 | Hard exercise or sport 6–7 days/week |
| Extra Active | × 1.9 | Physical job plus hard training, or twice-daily training |
How to use this number: The maintenance estimate is the calorie level at which, in theory, your weight stays stable. To lose weight, you create a deficit below maintenance (commonly 250–500 kcal/day is a moderate, sustainable approach). To gain muscle/weight, you eat above maintenance.
Why this is still an estimate: Activity multipliers are averages. Two people with the same job title (“desk job”) can have very different total daily step counts, fidgeting levels (NEAT — Non-Exercise Activity Thermogenesis), and metabolic efficiencies. The multiplier system is a useful starting point, not a precise measurement.
The right way to use it: Set your estimated maintenance, track your actual calorie intake for 2–3 weeks while weighing yourself daily and computing weekly averages. If your weight is stable, you found your actual maintenance. If it’s drifting up or down, adjust by 100–200 kcal and repeat. Real-world calibration always beats equation-based estimates.
For a more comprehensive planning tool with macro targets, see our TDEE calculator.
Katch–McArdle vs Mifflin–St Jeor vs Harris–Benedict: which should I use?
Each equation was designed under different assumptions and validated against different populations. Understanding these differences helps you choose the right tool for your situation.
Mifflin–St Jeor (1990) is the most widely validated formula for the general healthy adult population. It uses age, sex, height, and total body weight. In multiple independent validation studies, it consistently outperforms Harris–Benedict in predicting measured RMR. If you don’t have body fat % data, Mifflin–St Jeor is the default recommendation in nutrition and dietetics practice.
Harris–Benedict (Revised, 1984 — Roza & Shizgal) is the classic formula, originally published in 1919 and revised in 1984. It also uses age, sex, height, and weight. It tends to slightly overestimate RMR compared to direct measurement, which is why Mifflin–St Jeor gradually displaced it as the preferred default in clinical and research settings.
Katch–McArdle uses lean body mass only — no age, no sex, no height inputs. Its theoretical advantage is that it captures the difference in metabolic rate between two people with the same total weight but different body compositions. For example, a 70 kg person at 15% body fat has significantly more metabolically active tissue than a 70 kg person at 35% body fat, and Katch–McArdle will produce meaningfully different results for those two individuals where Mifflin–St Jeor would be closer (but not identical, since height and age also differ in practice).
| Formula | Inputs required | Best for | Main limitation |
|---|---|---|---|
| Mifflin–St Jeor | Age, sex, height, weight | General population; most validated | Does not distinguish body composition |
| Harris–Benedict (Revised) | Age, sex, height, weight | Comparison / legacy contexts | Tends to slightly overestimate RMR |
| Katch–McArdle | Weight + body fat % | People with reliable BF% data | Only as good as the BF% estimate |
Practical decision rule:
- Do you have a reliable body fat % from DEXA or consistent BIA? → Katch–McArdle may be marginally more informative.
- Are you estimating body fat % by eye, from a photo comparison, or from a single handheld BIA reading? → The error in your BF% estimate will likely make Katch–McArdle less accurate than Mifflin–St Jeor. → Use Mifflin–St Jeor.
- Are you tracking body composition over months and have consistent BIA data? → Katch–McArdle can be useful as a longitudinal tracking formula — as your LBM changes, so does your BMR estimate, giving you a more responsive picture.
A deeper side-by-side guide with worked examples is available at BMR Formula Comparison. You can also compare all three formulas on the main BMR calculator.
How sensitive is Katch–McArdle to body fat % errors?
This is one of the most practically important questions to understand before relying on Katch–McArdle results, and the math is straightforward.
For every 1 percentage point error in body fat %, your LBM estimate shifts by 1% of your total body weight — and because the formula multiplies LBM by 21.6, that shifts your BMR estimate by:
ΔBMRapprox = 21.6 × (total weight in kg × 0.01)
For a 70 kg person: 21.6 × 0.70 = ~15 kcal/day per 1% BF error. That sounds small. But consumer body fat measurement methods commonly have error ranges of 3–8 percentage points (BIA vs DEXA) or even larger (visual estimates). At 5% BF error on a 70 kg person: 5 × 15 = 75 kcal/day of BMR error. At 80 kg with 8% BF error: 8 × 21.6 × 0.80 = ~138 kcal/day of BMR error.
What this means in practice:
- A 138 kcal/day BMR error translates to a meaningfully different maintenance calorie estimate once an activity multiplier is applied (e.g. at ×1.55 that becomes ~214 kcal/day of maintenance error).
- If you are comparing your Katch–McArdle result to Mifflin–St Jeor and they disagree by 100–200 kcal/day, the most likely explanation is body fat % measurement error — not that one formula is “wrong.”
- Consistency matters more than accuracy: if you always use the same BIA scale under the same conditions (morning, pre-breakfast, after using the toilet), the trend in your results over months is more informative than any single reading.
Bottom line: treat Katch–McArdle results as a planning estimate with a realistic uncertainty band of ±10–15%, and calibrate against your actual weight trend over several weeks rather than treating the number as precise.
Why might my Katch–McArdle BMR be higher or lower than I expected?
If your result looks surprisingly high or low, work through these common reasons systematically before concluding the formula is wrong.
Result is higher than expected:
- Body fat % entered is too low. If your BF% is underestimated, LBM is overestimated, and BMR comes out high. Recheck your measurement method. Handheld BIA devices are known to underestimate BF% in athletes and lean individuals, while overestimating in others.
- High lean body mass is genuinely driving a higher BMR. Athletes, particularly those with significant muscle mass, legitimately have higher resting metabolic rates. This is one of the main reasons Katch–McArdle is considered advantageous for trained individuals.
- Weight entered in wrong units. If you entered kg when the calculator was set to lb (or vice versa), your LBM and BMR will be off by a large margin.
Result is lower than expected:
- Body fat % entered is too high. Overestimated BF% reduces LBM and therefore reduces BMR.
- Comparison to another formula using sex/age/height inputs. If you are comparing Katch–McArdle to Mifflin–St Jeor and they disagree, this is most commonly a body fat % estimation issue, not a formula flaw.
- Your actual metabolic rate may be lower than average. Individuals with hypothyroidism, significant caloric restriction history (metabolic adaptation), or certain medications can have measured RMR values meaningfully below any equation’s prediction. A predictive equation cannot detect this — only clinical testing can.
The calibration approach: Rather than debating which formula is “correct,” track your actual calorie intake and body weight simultaneously for 3–4 weeks. Use the calculator’s maintenance estimate as your starting point. If weight trends up, your actual maintenance is below the estimate; if it trends down, it’s above. Adjust in 100–200 kcal increments.
Individual metabolic variation is real. Predictive equations explain most of the variance in a population, but not all of it in any given individual.
Is Katch–McArdle better for athletes or people with unusual body compositions?
This is the primary population for whom Katch–McArdle is specifically recommended over Mifflin–St Jeor, and the reasoning is worth explaining fully.
Mifflin–St Jeor (and Harris–Benedict) were validated on populations with roughly average body composition for their demographic group. When you apply those formulas to individuals with atypically high lean mass — competitive bodybuilders, powerlifters, experienced swimmers, rugby players — the formulas tend to underestimate BMR. This is because the formula’s weight coefficient essentially assumes an “average” proportion of lean to fat tissue for a given total weight. Athletes carry more lean mass than average for their weight, so the average formula undershoots.
Katch–McArdle sidesteps this problem by using LBM directly. A 90 kg athlete at 8% body fat (LBM = 82.8 kg) and a 90 kg sedentary individual at 30% body fat (LBM = 63 kg) will receive the same Mifflin–St Jeor estimate (same weight) but very different Katch–McArdle estimates:
- Athlete: BMR = 370 + (21.6 × 82.8) = 2,158 kcal/day
- Sedentary: BMR = 370 + (21.6 × 63) = 1,731 kcal/day
That 427 kcal/day difference is meaningful for calorie planning, and Katch–McArdle correctly captures it where Mifflin–St Jeor would give both individuals the same output.
Caveats for athletes:
- Body fat % measurement is especially tricky for athletes. DEXA is the gold standard; BIA and skinfold methods can be less reliable at very low body fat levels. If your BF% estimate is unreliable, the advantage of Katch–McArdle over Mifflin–St Jeor disappears.
- Katch–McArdle was not validated exclusively on athletes — it was derived from a mixed population. Even for athletes, treat it as an improved estimate, not a precise measurement.
- For elite athletes, sport-specific energy expenditure studies and registered sports dietitian guidance will always be more appropriate than any online predictive calculator.
Similarly, Katch–McArdle can be useful for people on the other extreme — those with very high body fat who carry significant lean mass underneath — because it avoids inflating BMR estimates that Mifflin–St Jeor might produce when weight alone is very high.
Common mistakes when using Katch–McArdle (and how to avoid them)
Most errors with Katch–McArdle fall into a predictable set of categories. Here is a complete list with explanations and corrections.
Mistake 1: Treating an imprecise BF% as precise input.
A single BIA reading taken at an arbitrary time of day, after a meal, or while dehydrated can easily be off by 5+ percentage points. Plugging that number into Katch–McArdle and then treating the BMR output as accurate creates false confidence. Fix: use a consistent measurement protocol, or use Mifflin–St Jeor if BF% is uncertain.
Mistake 2: Comparing BF% readings from different methods.
DEXA, air displacement plethysmography (Bod Pod), hydrostatic weighing, BIA, and skinfold calipers all use different physical principles and produce systematically different results. It is not meaningful to compare a 22% reading from DEXA one month with a 19% reading from a BIA scale the next month and attribute the 3% change to body composition progress. Always compare within the same method under the same conditions.
Mistake 3: Using BMR as a calorie intake target.
BMR is what your body burns at complete rest. You are not at rest all day. Eating at BMR level would put almost everyone in a meaningful caloric deficit — sustainable only for short periods and not without risk for many people. Always apply an activity multiplier to get maintenance, then set intake relative to maintenance.
Mistake 4: Overreacting to short-term scale fluctuations.
Daily body weight can fluctuate by 1–3 kg due to water retention, glycogen storage, bowel content, and hormonal cycles — none of which reflects fat gain or loss. Making calorie adjustments based on a single day’s weigh-in introduces noise into the feedback loop. Track weekly averages over at least 3–4 weeks before drawing conclusions.
Mistake 5: Expecting Katch–McArdle to account for metabolic adaptation.
After significant caloric restriction (e.g., a prolonged fat loss diet), measured RMR often drops beyond what changes in LBM would predict — a phenomenon called adaptive thermogenesis or metabolic adaptation. Predictive equations cannot model this. If you have been in a prolonged deficit and your actual weight trend doesn’t match your calorie targets, metabolic adaptation may be a factor — and this requires real-world calibration or clinical assessment, not a formula adjustment.
Mistake 6: Applying multipliers inaccurately.
People consistently overestimate their activity level. “Moderate exercise 3 days per week” sounds like ×1.55, but if the rest of the day is sedentary (desk job, car commute, minimal steps), actual PAL may be closer to ×1.375. Starting with a conservative multiplier and adjusting upward based on actual weight trend is safer than starting high.
Mistake 7: Not accounting for body composition changes when re-calculating.
If you lose weight and also measure body fat % at the same time, always recalculate both LBM and BMR together. It’s possible to lose total weight but increase LBM (muscle gain offsetting fat loss), which changes your BMR trajectory in a meaningful way. Katch–McArdle is actually useful here — unlike weight-based formulas, it will correctly reflect LBM-preserving weight loss as a less dramatic BMR drop.
How should I use this calculator as part of a longer-term nutrition plan?
A predictive BMR calculator is most useful as a starting point, not an endpoint. Here is a practical framework for turning this number into actionable, self-calibrating guidance.
Step 1 — Get a baseline BMR estimate.
Use this calculator with the best body fat % estimate you have access to. If in doubt, also run Mifflin–St Jeor on the main BMR calculator and note whether the two estimates are reasonably close. Large disagreements (200+ kcal/day) suggest BF% measurement uncertainty is significant.
Step 2 — Set a conservative starting maintenance estimate.
Apply an activity multiplier. If you are unsure of your activity level, start one level lower than you think you are. It is easier to adjust upward after seeing a weight trend than to explain unexpected weight gain.
Step 3 — Track calories and weight simultaneously for 3–4 weeks.
Use a food tracking app to log intake. Weigh yourself daily at the same time (morning, post-toilet, pre-breakfast) and compute the weekly average. Compare Week 1 average to Week 4 average.
Step 4 — Calibrate.
If weight is stable: your logged intake is at or near your actual maintenance. Adjust the equation estimate to match. If weight is drifting, adjust intake by 100–200 kcal in the appropriate direction and repeat for another 3 weeks.
Step 5 — Recheck body composition periodically.
Every 8–12 weeks, remeasure body fat % (same method, same conditions). If LBM has changed meaningfully, recalculate BMR. This is where Katch–McArdle provides a specific advantage over weight-based formulas — it updates with your changing body composition, not just your changing weight.
For a fully integrated tool that walks through maintenance, deficit, surplus, and macro targets in one place, use our TDEE calculator.
Sources & Further Reading
These references support the formulas and concepts used in this calculator.