Child BMI Calculator (BMI Percentile, Ages 2–19 — CDC Method)
Child BMI Calculator for Kids & Teens (Ages 2–19)
Calculates BMI, BMI-for-age percentile, and screening categories for children and teens ages 2–19 using CDC growth chart LMS reference data (screening only; not a diagnosis). Want calorie needs too? Use our Child TDEE Calculator. For height and weight percentiles, use the Height & Weight Percentile Calculator.
It uses the official CDC BMI-for-age reference data for boys and girls aged 2–19 — the same method paediatricians use on CDC growth charts.
- BMI + CDC BMI-for-age percentile (age in months + sex)
- Weight category + % of the 95th percentile (severity screening)
- Healthy weight range at the same height (5th–<85th percentile)
- Extra help for ages 12–19: Teen BMI results explained
- Optional: download/share results and view the growth chart
Quick answer (what this calculator does)
Child BMI is calculated from height and weight, then interpreted using a CDC BMI-for-age percentile that depends on age (in months) and sex. This tool estimates BMI, percentile, category, % of the 95th percentile, and a healthy weight range at the same height.
- Age in months (small differences can change percentile)
- Accurate height (errors strongly affect BMI)
- Sex (CDC reference curves differ)
Interpretation: percentiles compare to same-age, same-sex peers (CDC reference).
Disclaimer: screening/education only—talk to a pediatric clinician for medical advice.
For adults 20+, use our Adult BMI Calculator. Browse more tools in our Health Calculators hub.
Child’s Details
Calculation Steps
- Enter details to see the steps.
Results

Table of Contents
Body mass index-for-age percentiles: Boys, 2 to 19 years
Chart loads when it scrolls into view (performance-optimized).
Calculation Breakdown
| Item | Value |
|---|---|
| Enter details to see the breakdown. | |
CDC BMI-for-Age Categories
| Category | Rule | Meaning |
|---|---|---|
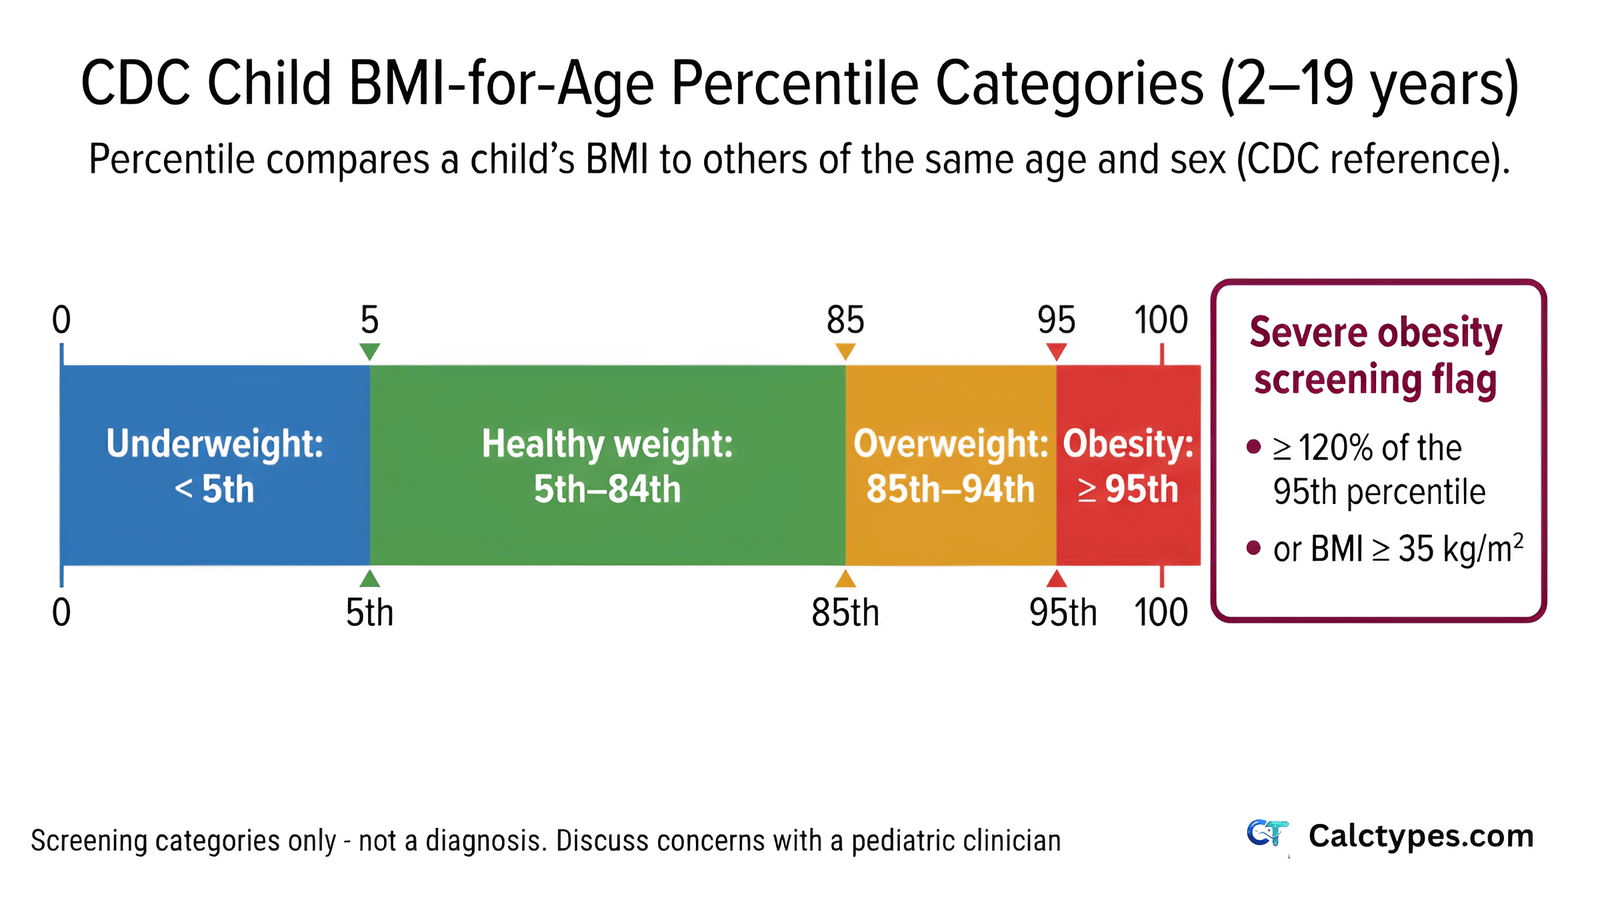
| Underweight | < 5th percentile | Below the healthy weight range for age and sex |
| Healthy weight | 5th to < 85th percentile | Healthy weight range for age and sex |
| Overweight | 85th to < 95th percentile | Above the healthy weight range for age and sex |
| Obesity | ≥ 95th percentile | Significantly above the healthy range for age and sex |
| Severe Obesity | ≥ 120% of the 95th percentile OR BMI ≥ 35 kg/m² | Highest-risk screening category (subset of obesity). Medical guidance is strongly recommended. |
Questions People Ask About Child BMI
General guidance about child BMI. Consult a healthcare professional for personalized advice.
What age range does this calculator cover?
This calculator is for children and teens aged 2 to 19 years. That age range matters because child BMI is interpreted differently from adult BMI. For children and teens, the calculator first computes BMI from height and weight, then compares that BMI with a same-age and same-sex reference group.
For infants and toddlers under age 2, clinicians usually use different growth standards, such as weight-for-length, length-for-age, and head circumference charts. BMI-for-age is generally not the main screening tool under 2 because body proportions and growth patterns change rapidly during infancy.
For adults 20 and older, use an adult BMI calculator. Adult BMI categories use fixed cutoffs, while child and teen BMI uses age- and sex-specific percentiles.
Why does child BMI use percentiles instead of fixed categories?
Children’s body composition changes as they grow. A BMI value that’s typical at one age may be unusual at another. During childhood and adolescence, height, weight, fat mass, lean mass, and puberty timing all change at different rates. That is why a fixed adult-style cutoff would be misleading for many children.
BMI-for-age percentiles compare a child’s BMI with others of the same age and sex in a reference population. This approach answers a more useful question: “Where does this child’s BMI fall compared with children of the same age and sex?”
For example, a BMI of 18 may mean something very different for a 6-year-old than for a 16-year-old. A younger child with that BMI might fall high on the growth chart, while an older teen with the same BMI might fall in a healthy range. Percentiles adjust for those normal age-related shifts.
What reference data does this calculator use?
It uses the CDC BMI-for-age reference from the 2000 revised growth charts, using CDC LMS parameter data to convert BMI into a percentile.
The LMS method is a statistical approach used in growth charts. In simple terms, it describes how BMI values are distributed at each age and sex using three parameters: L, M, and S. Those parameters allow a raw BMI number to be converted into a z-score and then into a percentile.
This is important because the relationship between BMI and percentile is not linear across childhood. A one-point BMI difference may have a different percentile impact depending on age, sex, and where the child already falls on the curve.
Is this calculator accurate outside the United States (CDC vs WHO)?
This tool uses the CDC reference, commonly used for screening and education. Some countries or health systems use WHO references (or national growth charts). For country-specific interpretation, follow local clinical guidance.
The CDC and WHO references are both respected, but they are not identical. They were developed from different datasets and may produce slightly different percentiles or category interpretations for the same child. Some countries also use national growth references because local population patterns, clinical policies, and public health thresholds may differ.
If you are outside the United States, this calculator can still be useful for a general educational estimate, but it should not override local pediatric guidance. If a school, clinic, or national health service uses WHO or national charts, compare results within that same system rather than mixing chart systems.
What is a “normal” BMI for a child?
For ages 2–19, “normal” is usually discussed using percentiles, not a single BMI number. A common CDC screening definition of healthy weight is 5th to <85th percentile for age and sex.
This does not mean every child between the 5th and 85th percentile is automatically healthy, or that every child outside that range is automatically unhealthy. BMI percentile is one screening indicator. Pediatric clinicians interpret it alongside height growth, weight history, puberty timing, activity level, diet quality, sleep, medications, family history, and sometimes lab results.
A “normal BMI” can also look different across ages. A BMI number that falls in a healthy range for one child may fall into a different percentile category for another child of a different age or sex. That is why child BMI charts and calculators ask for exact age and sex.
How do you calculate BMI for kids?
First calculate BMI: weight (kg) ÷ height² (m²). Then interpret that BMI using a BMI-for-age percentile based on the child’s age (in months) and sex. This calculator performs both steps.
The basic BMI formula is the same for children and adults, but the interpretation is different. For adults, BMI is usually compared with fixed cutoffs such as 18.5, 25, and 30. For children and teens, the calculated BMI is converted into a percentile because normal BMI changes with age and differs between boys and girls.
Example: if a child weighs 30 kg and is 1.35 m tall, BMI = 30 ÷ (1.35 × 1.35) = 30 ÷ 1.8225 = 16.5 kg/m². That raw BMI number is only the first step. The next step is checking where 16.5 falls on the BMI-for-age chart for that child’s exact age and sex.
What does BMI percentile mean?
A percentile shows how a child’s BMI compares with a reference group of the same age and sex. For example, the 60th percentile means the BMI is higher than about 60% of peers in the reference data.
It does not mean the child’s body is 60% fat, and it does not mean the child has a “score” of 60 out of 100. It is a ranking compared with a reference population. A child at the 60th percentile has a BMI higher than about 60 out of 100 comparable children and lower than about 40 out of 100.
Percentiles are useful because they adjust for age and sex. A percentile can also help track trends over time. A stable percentile over several years may be less concerning than a rapid rise or fall across major percentile bands, depending on context.
What BMI percentile is considered overweight or obese for kids?
Common CDC screening categories are:
Underweight: <5th percentile
Healthy weight: 5th to <85th percentile
Overweight: 85th to <95th percentile
Obesity: ≥95th percentile
These are screening categories, not a diagnosis.
These categories help flag children who may benefit from closer review, but they do not tell the whole story. A child near the 85th percentile with strong fitness, stable growth, and no health concerns may need a different conversation than a child whose BMI percentile has risen rapidly, whose blood pressure is elevated, or who has symptoms such as sleep apnea or fatigue.
For very high BMI values, clinicians may also discuss severe obesity using measures such as percentage of the 95th percentile. That helps distinguish children just above the 95th percentile from those much farther above it, because health risk and clinical follow-up may differ.
What is “% of the 95th percentile”?
It estimates how far a child’s BMI is above the 95th percentile for their age and sex. It’s often used to describe severity within the obesity range (screening context only).
The idea is simple: the calculator compares the child’s actual BMI with the BMI value that corresponds to the 95th percentile for that child’s age and sex. If the child’s BMI is 20% higher than that reference value, the result may be described as 120% of the 95th percentile.
This is useful because once BMI is above the 95th percentile, standard percentiles become less descriptive. Many children with very different BMI values can appear near the top of the percentile scale. “% of the 95th percentile” gives a clearer severity estimate for clinical screening.
My child’s BMI percentile seems high. Should I be worried?
A single BMI reading is a screening tool, not a diagnosis. Growth spurts, puberty timing, muscle mass, and genetics can affect BMI. If you’re concerned—especially if the percentile is persistently high or rising over time—discuss it with a pediatric clinician.
A high percentile does not automatically mean something is wrong, but it is worth interpreting carefully. Clinicians usually look at the child’s long-term growth chart, not only today’s number. They may ask whether the BMI percentile has been stable for years, rising quickly, or changing alongside puberty, sports participation, medication use, sleep problems, or family stress.
It is also important to avoid panic-based responses. Strict dieting, food restriction, or negative comments about body size can harm a child’s relationship with food and increase risk of disordered eating. The safest first step is usually a supportive, health-focused conversation with a clinician.
Can BMI be misleading for athletic or muscular kids?
Sometimes. BMI doesn’t directly measure body fat and may not reflect body composition for athletic or muscular kids. A clinician can consider BMI alongside growth patterns and other health information.
BMI is calculated from height and weight, so it cannot tell whether weight comes from muscle, bone, fat, water, or normal growth. A muscular teen athlete may have a higher BMI percentile without having excess body fat. Similarly, a child with a “normal” BMI can still have low fitness, poor nutrition, or metabolic risk factors.
That said, “athletic” should not be used to dismiss every high BMI percentile. The best interpretation combines BMI percentile with growth history, waist or body-composition assessment when appropriate, blood pressure, sleep quality, fitness, menstrual history in teens, and overall health.
Can you tell if a child is overweight from weight alone?
No. Weight alone can’t answer that. You need height, sex, and exact age to estimate BMI-for-age percentile. Use the calculator for a screening estimate, and consult a clinician for personalized interpretation.
A 40 kg weight may be expected for one child and concerning for another, depending on height, age, sex, puberty stage, and growth pattern. For example, a tall 12-year-old and a short 8-year-old may weigh the same, but their BMI percentiles could be very different.
Weight alone also misses growth velocity. A child may gain weight normally before a height spurt, or may appear to gain too slowly if height is increasing quickly. Clinicians use growth charts because the pattern over time matters more than a single number.
Why does the calculator ask for age in months?
For children and teens, BMI percentiles depend on exact age. Small differences (for example, 13 years 0 months vs. 13 years 11 months) can change the percentile. Using age in months improves accuracy.
Childhood growth is not evenly paced. A child may grow rapidly in one period and more slowly in another. Puberty can also shift height, weight, lean mass, and fat distribution quickly. Because the reference curves change month by month, exact age helps place the BMI on the correct point of the growth chart.
This is especially important near category boundaries. A child close to the 85th or 95th percentile might fall slightly differently if age is rounded too broadly. Using months reduces avoidable classification errors.
Is this CDC child and teen BMI calculator accurate?
It’s accurate for calculating BMI and estimating the CDC BMI-for-age percentile when measurements and age are entered correctly. However, BMI percentiles are a screening tool, not a diagnosis—clinicians interpret results alongside growth patterns, puberty timing, and overall health.
The math can be accurate while the interpretation still requires context. Measurement errors are common: shoes left on during height measurement, rounded height, outdated weight, incorrect birth date, or choosing the wrong sex field can shift the percentile. The result is only as reliable as the inputs.
Accuracy also depends on purpose. For general screening, CDC BMI-for-age percentiles are useful. For diagnosing a medical condition, assessing body fat, evaluating growth disorders, or making a treatment plan, BMI alone is not enough.
How should I measure my child’s height and weight at home?
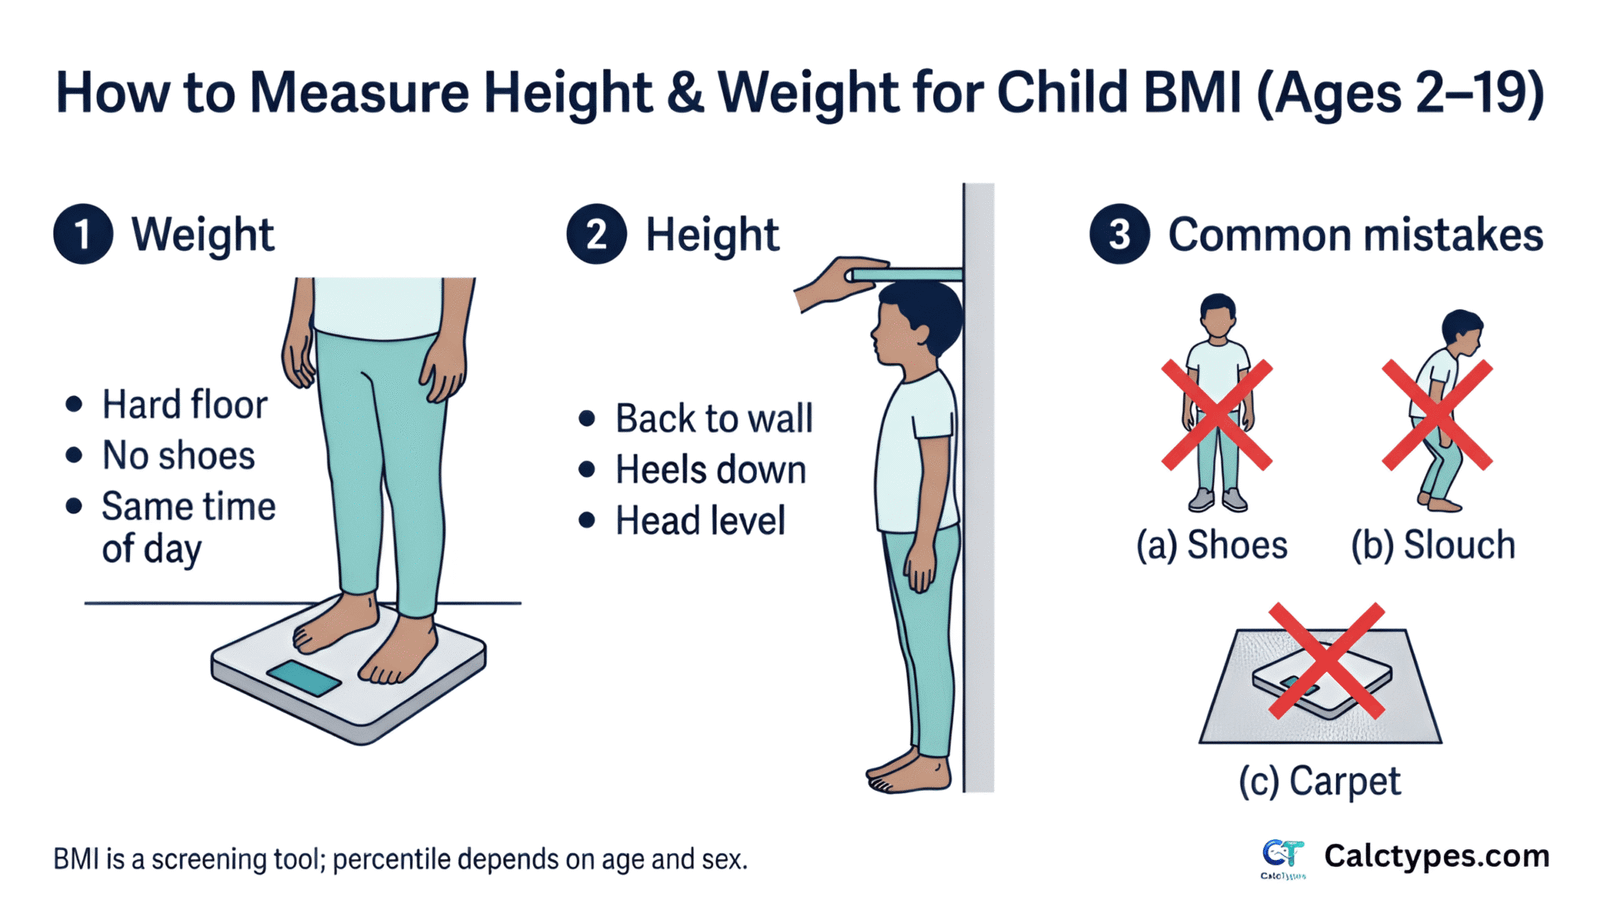
Accurate measurements are the foundation of a useful child BMI percentile. For weight, use a reliable scale on a hard, flat surface. Have the child wear light clothing and no shoes. Try to measure at a consistent time of day if you are tracking trends.
For height, have the child stand barefoot with heels together, back straight, eyes looking forward, and heels, buttocks, shoulders, or head touching the wall when possible. Use a flat object, such as a book, to mark the top of the head at a right angle to the wall, then measure from the floor to the mark.
Small height errors can significantly change BMI because height is squared in the BMI formula. For example, under-measuring height can make BMI look artificially high. If a result seems unusual, recheck height and weight before interpreting the percentile.
How often should I check my child’s BMI percentile?
For most children, BMI percentile does not need to be checked frequently at home. Pediatric visits usually include height and weight measurements, and clinicians track growth over time. Checking too often can create unnecessary stress and may lead to overreacting to normal short-term fluctuations.
If a clinician has advised monitoring because of a growth concern, follow their recommended schedule. In many cases, looking at trends over months is more meaningful than checking weekly. Children grow in spurts, so short-term changes may not reflect true health changes.
A practical approach is to avoid turning BMI into a household score. Focus instead on stable routines: meals, movement, sleep, emotional wellbeing, and regular healthcare follow-up.
How is child BMI different from adult BMI?
Adult BMI is interpreted using fixed categories. Child and teen BMI is interpreted using percentiles because children are still growing. A BMI number that is healthy for a 17-year-old may be high for a 7-year-old.
Child BMI also accounts for sex because boys and girls have different average body composition patterns during growth and puberty. This is why the calculator asks for exact age and sex instead of using adult cutoffs.
Adult BMI categories should not be applied directly to children or teens. For a full explanation, see our guide to child BMI vs adult BMI percentiles.
How do puberty and growth spurts affect BMI percentile?
Puberty can temporarily change BMI percentile because height, weight, muscle, bone mass, and fat distribution do not all change at the same pace. Some children gain weight before a height spurt, while others grow taller first and appear leaner for a period.
Puberty timing varies widely. A child who enters puberty earlier may have a different BMI pattern than a peer of the same age who has not started puberty yet. This is one reason clinicians avoid judging a child’s health from a single BMI result.
The key question is whether the child’s overall growth pattern makes sense over time. For more context, read our guide on BMI during puberty and growth spurts.
What does a low BMI percentile mean in a child?
A low BMI percentile may mean the child has a smaller body build, but it can also signal undernutrition, illness, feeding difficulties, high activity with inadequate intake, gastrointestinal problems, endocrine conditions, or emotional stress. The CDC screening category for underweight is below the 5th percentile.
A child who has always tracked near a low percentile, is growing steadily in height, has good energy, and has no concerning symptoms may be different from a child whose BMI percentile drops suddenly. Sudden crossing downward across growth percentiles deserves closer attention.
Warning signs include unexplained weight loss, fatigue, delayed puberty, dizziness, frequent stomach symptoms, restrictive eating, fear of weight gain, or loss of menstrual periods in teens. In those cases, BMI should be interpreted by a pediatric clinician rather than managed at home.
Can a child have obesity if they look healthy?
Yes, it is possible for a child to fall in a BMI screening category associated with obesity and still appear active or “healthy” day to day. BMI categories are based on statistical risk, not appearance. Some health effects, such as elevated blood pressure, insulin resistance, fatty liver risk, or abnormal cholesterol, may not be visible.
It is also possible for appearance to be misleading in the other direction: a child with a “normal” BMI may have poor nutrition, low fitness, high stress, inadequate sleep, or emerging disordered eating. That is why BMI is only one part of a broader health picture.
The goal is not to judge a child’s appearance. The goal is to identify whether health-supporting habits, medical assessment, or family-based support may be helpful.
Can BMI diagnose overweight or obesity in children?
BMI percentile categories are screening tools. They can identify children who may fall into underweight, healthy weight, overweight, or obesity ranges, but a diagnosis and care plan require clinical judgment.
A clinician may confirm measurements, review growth charts, assess family history, ask about nutrition, activity, sleep, medications, and mental health, and check for related conditions. In some cases, they may order blood pressure checks or laboratory tests.
This distinction matters because a calculator cannot see the child, assess puberty stage, evaluate muscle mass, identify medication effects, or screen for eating disorders. It gives a useful starting point, not a final medical conclusion.
When should I see a pediatrician about my child’s BMI?
Consider discussing BMI with a pediatrician if the percentile is below the 5th percentile, at or above the 85th percentile, rising quickly, falling unexpectedly, or crossing major percentile lines. You should also seek guidance if there are symptoms, family history of metabolic disease, concerns about puberty, or emotional distress around food or body image.
A pediatrician can help determine whether the BMI pattern reflects normal growth, puberty timing, body build, lifestyle factors, medication effects, or a medical issue. They can also help prevent harmful responses such as restrictive dieting or weight-focused shame.
For more detailed guidance, see when to see a pediatrician about child BMI.
What might a pediatrician check after a high BMI percentile?
A pediatrician will usually start by confirming height and weight, reviewing the growth chart, and asking about the child’s health history. They may ask about sleep, snoring, physical activity, eating patterns, sugary drinks, screen time, medications, family history, stress, mood, and puberty.
Depending on age, BMI category, symptoms, and family history, they may check blood pressure or consider labs such as cholesterol, blood glucose or A1C, liver enzymes, or other tests. Not every child needs the same testing.
The best care is usually family-based and supportive. It focuses on sustainable health behaviors and medical risk reduction, not blame or rapid weight loss.
Should a child try to lose weight if their BMI percentile is high?
Not necessarily. Children are still growing, so the goal is often not rapid weight loss. Depending on age, growth stage, BMI category, and health status, a clinician may recommend weight maintenance while height increases, slower weight gain, or structured treatment in specific cases.
Unsupervised dieting can be risky for children and teens. It may interfere with growth, nutrient intake, puberty, sports performance, mental health, and relationship with food. Extreme restriction can also increase the risk of binge eating or eating disorders.
Safer approaches usually focus on the whole family: regular meals, more high-fiber foods, fewer sugary drinks, adequate protein, enjoyable activity, consistent sleep, and less weight-focused language. Medical guidance is especially important for younger children, teens, children with chronic conditions, and any child showing emotional distress around food or body size.
How should I talk to my child about BMI or weight?
Use calm, neutral, health-focused language. Avoid teasing, blame, labels, or comments that make the child feel their body is a problem. Children often internalize weight-related comments, and shame can worsen eating behaviors, self-esteem, and mental health.
Instead of saying “you need to lose weight,” focus on family habits: “We’re going to work on meals that give us energy,” “Let’s find activities we enjoy,” or “We’re making sleep and breakfast more consistent.” This keeps the child from feeling singled out.
If your child asks direct questions, answer honestly but gently. You can explain that BMI is one screening number doctors use, not a measure of worth or beauty. For a deeper guide, see how to talk to a child about weight and BMI.
What lifestyle habits can support a healthier BMI percentile?
The most effective habits are usually simple, consistent, and family-based. Children do better when the environment supports health rather than relying on willpower. This means regular meals, accessible fruits and vegetables, water as the default drink, active play, consistent sleep, and limits on constant snacking or sugary drinks.
Physical activity should be enjoyable and age-appropriate. It does not have to be formal exercise. Walking, cycling, dancing, sports, playground time, swimming, and active family outings all count. The goal is to build a lifestyle the child can maintain without feeling punished.
Avoid framing habits as “fixing BMI.” Better framing is energy, strength, mood, sleep, confidence, and health. BMI percentile may improve over time, but the first goal is a healthier routine.
What nutrition changes are usually safest for children?
For most children, safe nutrition changes are additive and structured rather than restrictive. Examples include regular breakfast, balanced meals, more fiber-rich foods, vegetables, fruit, beans, whole grains, yogurt or other protein sources, and water instead of frequent sugary drinks.
A helpful plate pattern is: a protein food, a high-fiber carbohydrate, a fruit or vegetable, and a healthy fat when appropriate. This supports fullness, growth, and stable energy. Children should not be placed on very low-calorie diets unless specifically supervised by a qualified clinician.
Be careful with “good food/bad food” language. Strict food rules can backfire. A better approach is predictable meals and snacks, fewer sugar-sweetened beverages, less grazing, and more home food routines when possible.
How much exercise do children need?
Many public health guidelines recommend that children and teens get about 60 minutes or more of moderate-to-vigorous physical activity daily, with muscle- and bone-strengthening activities included several days per week. This can be broken into smaller chunks.
Activity should match the child’s age, interests, ability, and medical context. A child who dislikes team sports may enjoy dancing, martial arts, cycling, swimming, hiking, active games, or walking the dog. The best activity is the one the child will actually do consistently.
For children with asthma, disabilities, joint pain, severe obesity, heart conditions, or other medical concerns, ask a clinician about safe activity options. The goal is progress and participation, not punishment.
Do sleep, stress, and screen time affect BMI percentile?
They can. Sleep, stress, and screen time influence appetite, food choices, activity, routines, and hormones related to hunger and fullness. Short sleep is associated with higher risk of weight gain in children, partly because it can increase cravings, reduce activity, and disrupt meal timing.
Screen time can affect BMI indirectly by replacing movement, increasing exposure to food advertising, encouraging distracted eating, and delaying bedtime. Stress can also change eating patterns and family routines.
Practical changes include consistent bedtimes, screens out of bedrooms when possible, active breaks, family meals without screens, and stress support. These habits can improve wellbeing even if BMI percentile changes slowly.
Can medical conditions or medications affect child BMI?
Yes. Some medical conditions and medications can affect appetite, weight, growth, energy expenditure, or fluid balance. Examples include endocrine conditions, genetic syndromes, gastrointestinal disease, chronic inflammation, sleep apnea, depression, anxiety, and some medications used for mental health, seizures, allergies, inflammation, or other conditions.
This is one reason BMI should not be interpreted in isolation. A rising BMI percentile may reflect lifestyle factors, but it may also be influenced by medication changes, reduced activity due to injury, poor sleep, or a medical condition. A falling BMI percentile can also be a concern if it reflects illness, inadequate intake, malabsorption, or restrictive eating.
If BMI changes are rapid, unexpected, or accompanied by symptoms, consult a pediatric clinician rather than trying to solve it with diet changes alone.
Do race, ethnicity, or body build affect BMI interpretation?
BMI does not directly measure body fat, muscle, bone structure, or fat distribution. Body composition and cardiometabolic risk can vary across individuals and populations, so BMI percentile is not a perfect measure of health for every child.
Race and ethnicity should never be used to stereotype an individual child’s health. However, clinicians may consider family history, ancestry-related risk patterns, and social determinants of health when deciding whether additional screening is appropriate.
Body build also matters. Some children naturally have broader frames or more lean mass. Others may have normal BMI but higher metabolic risk due to low activity, poor sleep, or family history. That is why clinical interpretation includes more than BMI.
What is the difference between BMI percentile, BMI z-score, and LMS?
BMI percentile is the easiest result for most families to understand. It describes where a child’s BMI falls compared with children of the same age and sex in the reference data.
BMI z-score, sometimes called BMI standard deviation score, describes how far the child’s BMI is from the reference median in standard deviation units. Researchers and clinicians may use z-scores because they are more useful for statistical tracking, especially across time or groups.
LMS refers to the statistical parameters used to convert BMI into z-scores and percentiles. The calculator uses the CDC LMS values behind the scenes. Families usually do not need to calculate LMS manually, but it explains why exact age and sex are required.
What is severe obesity in children?
Severe obesity is a clinical screening term used when a child’s BMI is substantially above the obesity threshold. Clinicians often describe it using percentage of the 95th percentile, such as 120% or 140% of the 95th percentile, depending on the classification system.
This distinction matters because health risks and recommended evaluation may increase as BMI rises farther above the 95th percentile. Possible concerns include high blood pressure, abnormal cholesterol, insulin resistance, type 2 diabetes risk, sleep apnea, joint pain, fatty liver disease, and psychosocial stress.
Severe obesity should be handled with medical support. The response should be structured, compassionate, and family-based—not shame-based or focused on rapid unsupervised weight loss.
Can a child “grow out of” a high BMI percentile?
Sometimes a child’s BMI percentile improves as height increases, especially during growth spurts. However, it is not safe to assume every high percentile will resolve on its own. The pattern over time matters.
If a child is gaining height quickly and weight is stable, BMI percentile may fall naturally. If BMI percentile is rising steadily over multiple visits, or if there are health concerns, waiting without support may miss an opportunity for early prevention.
A balanced approach is to avoid panic while still taking the pattern seriously. Support healthy family routines, monitor growth at regular checkups, and ask a clinician whether follow-up is needed.
What if my child’s BMI percentile changes suddenly?
Sudden changes can happen because of measurement error, growth spurts, puberty, illness, medication changes, changes in activity, stress, or changes in eating patterns. The first step is to confirm the measurements and age entry.
If the change is real, the direction matters. A rapid rise may suggest changes in intake, activity, sleep, medications, or health. A rapid drop may suggest illness, inadequate intake, gastrointestinal issues, excessive exercise, or restrictive eating.
Sudden crossing of major percentile lines is a good reason to check in with a pediatric clinician, especially if symptoms are present.
What are eating disorder warning signs to watch for?
Weight and BMI conversations can unintentionally trigger harmful behaviors in some children and teens. Warning signs include skipping meals, rigid food rules, fear of weight gain, secretive eating, binge eating, purging, excessive exercise, sudden weight loss, dizziness, fainting, loss of menstrual periods, or intense distress about body shape.
Other signs may be emotional: irritability around meals, withdrawal from friends, avoiding family meals, constant calorie counting, or feeling guilty after eating. These concerns can occur at any BMI percentile, including in children who are classified as “healthy weight” or “overweight.”
Are there emergency signs related to child weight or BMI?
BMI itself is not usually an emergency measurement. However, certain symptoms around weight change, eating, or activity require prompt medical attention. Seek urgent care if a child has fainting, chest pain, difficulty breathing, severe dehydration, confusion, rapid unexplained weight loss, repeated vomiting, or signs of self-harm.
Also seek urgent help if a child is refusing food or fluids, purging, using laxatives or diet pills, exercising compulsively despite illness or injury, or expressing suicidal thoughts. These concerns are medical and mental-health issues, not calculator issues.
Does a high child BMI percentile increase future health risks?
A persistently high BMI percentile can be associated with higher risk of future health issues, including high blood pressure, abnormal cholesterol, insulin resistance, type 2 diabetes, fatty liver disease, sleep apnea, orthopedic problems, and continued obesity into adulthood.
Risk is not destiny. Many factors influence long-term health, including nutrition, activity, sleep, mental health, access to healthcare, family habits, socioeconomic factors, genetics, and stigma. Early supportive intervention can improve health markers even before major BMI changes occur.
The goal is not to make a child fear the future. The goal is to use BMI percentile as one signal that can guide earlier, kinder, more effective health support.
What should I do if school BMI screening sends home a letter?
School BMI screening letters can be confusing and sometimes upsetting. Treat the letter as a screening notice, not a diagnosis. Schools may use height and weight measurements collected quickly, so measurement error is possible.
If the result concerns you, confirm measurements at home or with your child’s clinician. Avoid showing panic or making negative comments to your child. A calm response might be: “This is one health screening number. We can ask the doctor what it means.”
For more context, see our guide to school BMI screening.
How to Use This Kids BMI Calculator (Child & Teen)
- Select sex (used for the CDC BMI-for-age reference curves).
- Enter age in years and months (months improve accuracy).
- Choose metric (kg/cm) or imperial (lb/ft/in), then enter weight and height.
- Review BMI, percentile, category, % of 95th, and the chart.
Tip: measure height without shoes, standing straight, and re-check weight on a stable scale.
The Problem This Calculator Solves
For kids and teens, a BMI number by itself is not enough. The same BMI can be normal at one age and high at another. This calculator automates the two-step process:
- Compute BMI from height and weight.
- Interpret BMI using CDC BMI-for-age percentiles based on age in months and sex.
It also estimates a healthy weight range at the same height (5th–<85th percentile).
Worked Examples (Beginner + Real‑World)
Example 1 (Beginner): BMI math
- Age: 10y 6m (enter years + months)
- Height: 138 cm (1.38 m)
- Weight: 32 kg
- BMI: 32 ÷ 1.38² = 32 ÷ 1.9044 ≈ 16.8
- Next step: the calculator uses age + sex to convert BMI into a percentile.
Example 2 (Real‑world): same BMI, different meaning
Two children can share the same BMI but land in different percentiles because their reference curves differ by age/sex. That’s why pediatric BMI uses percentiles rather than adult cutoffs.
- Child A: 8y boy, BMI 18 → percentile might be different than…
- Child B: 14y boy, BMI 18
- Takeaway: use percentiles to interpret, and track trends over time.
Prefilled examples (CDC BMI-for-age method)
These are real-world sample entries. Click an example to open the calculator prefilled (BMI-for-age percentile uses CDC growth chart reference data).
- Example: Boy, age 13 years 11 months — height 166.4 cm, weight 47 kg — open prefilled example
- Example: Girl, age 10 years 6 months — height 138 cm, weight 32 kg — open prefilled example
- Example: Boy, age 15 years 0 months — height 171 cm, weight 63 kg — open prefilled example
- Example: Girl, age 8 years 3 months — height 130 cm, weight 28 kg — open prefilled example
How to Calculate BMI for Kids (Formula + Method)
Step 1 — Calculate BMI
- BMI = weight (kg) ÷ height² (m²)
- If you use pounds and feet/inches, this calculator converts to metric first.
Step 2 — Convert BMI to a BMI‑for‑age percentile (CDC)
- Use the child’s age in months and sex to select CDC LMS parameters.
- Convert BMI to a z‑score using the LMS method, then convert z‑score to percentile.
What BMI Percentile Means (in plain English)
A percentile compares your child’s BMI to a CDC reference population of the same age and sex. For example, the 60th percentile means the BMI is higher than about 60% of same‑age, same‑sex peers in the reference data.
Percentiles are used for screening—clinicians also consider growth patterns, puberty timing, medical history, and body composition.
What Is a “Normal” BMI for a Child?
For ages 2–19, “normal” is typically discussed using percentiles rather than a single BMI number.
- Healthy weight: 5th to <85th percentile
- Underweight: <5th percentile
- Overweight: 85th to <95th percentile
- Obesity: ≥95th percentile
Puberty Timing Can Shift BMI Percentiles (Common Confusion)
During puberty, height and weight may change quickly and not always at the same time. This can temporarily shift BMI and percentile even when overall health is fine. If you notice a big percentile change, consider:
- Has height changed recently (or is a growth spurt starting)?
- Was measurement taken consistently (same scale, similar clothing)?
- Is the trend persistent over multiple measurements?
If the percentile remains high or rises over time, a pediatric clinician can interpret it in context.
Troubleshooting
- Results show “—”: check that age is 2–19 and months are 0–11.
- Percentile looks surprising: re-check height—small errors matter a lot.
- Imperial height errors: inches must be 0–11 (not 12).
- “Unusual values” warning: your entry may be outside typical ranges; re-check measurements.
CDC vs WHO BMI-for-Age: What’s the Difference?
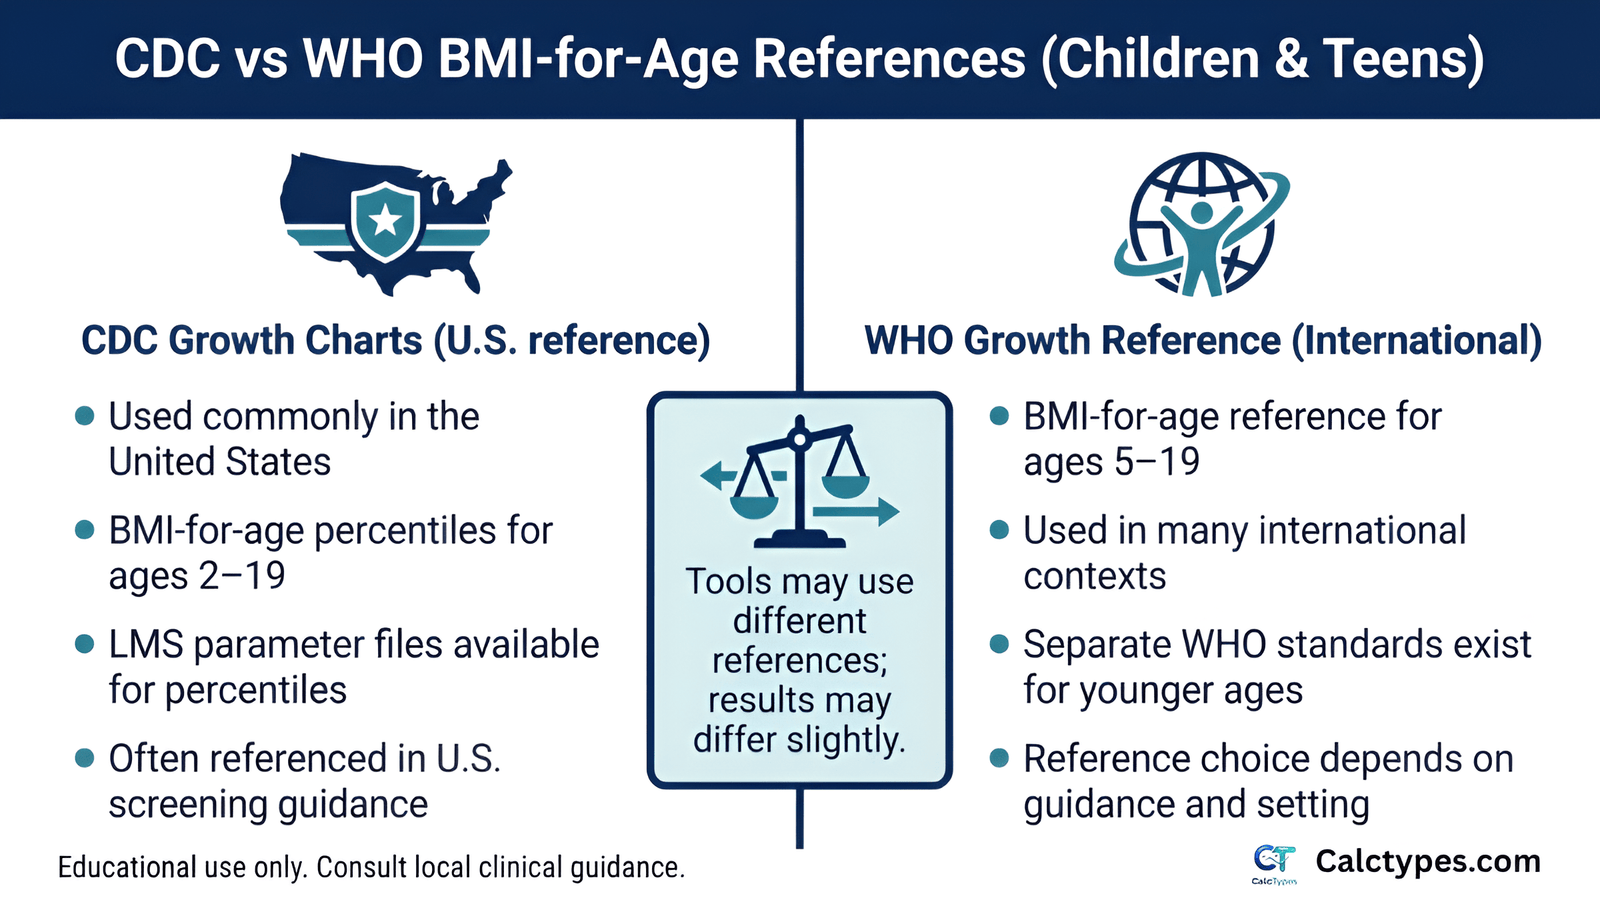
This calculator uses CDC BMI-for-age (2–19) reference data. In some countries or systems, WHO references (or national growth charts) may be preferred.
- CDC: commonly used in the United States; provides LMS parameter files.
- WHO: provides growth references (including ages 5–19) plus separate standards for younger ages.
- Practical tip: if your clinic uses a specific chart, interpret results using that same reference.
Limitations of BMI in Children (Important)
- BMI doesn’t directly measure body fat. Athletic or muscular kids may be misclassified (see teen BMI results explained).
- Percentiles are reference-based. They don’t include medical history, puberty stage, or body composition.
- Use trends. One measurement can be misleading; patterns over time matter more.
When BMI can fail (examples)
- High muscle mass (some sports) → BMI may overestimate fatness.
- Fluid retention or some medical conditions → weight may not reflect fat mass.
- Rapid growth spurts → temporary percentile shifts.
Accuracy & Editorial Policy
- Data basis: CDC BMI-for-age (2000 revised growth charts) LMS parameters.
- Purpose: educational + screening only; not a diagnosis.
- Updates: logic and references reviewed periodically. Last updated: .
- Policies: see Editorial policy and Disclaimer.
Methodology (How This Calculator Works)
Method used: CDC BMI-for-age growth chart reference (LMS parameters, ages 2–19).
1) BMI calculation
- BMI = weight (kg) ÷ height² (m²)
- Imperial entries are converted to metric before calculation.
2) CDC BMI-for-age percentile
- Uses CDC 2000 growth chart LMS parameters for the selected sex and age (in months).
- Computes a z-score using the LMS method, then converts z-score to percentile using a normal distribution approximation.
3) Category interpretation
- Underweight: <5th percentile
- Healthy weight: 5th to <85th percentile
- Overweight: 85th to <95th percentile
- Obesity: ≥95th percentile
- Severe obesity (screening flag): ≥120% of the 95th percentile or BMI ≥35 kg/m²
Sources & Further Reading
This calculator uses CDC BMI-for-age growth chart reference data.
Do not use this information to start restrictive dieting, rapid weight-change plans, or supplements/medications for a child/teen without professional guidance. Seek prompt medical care if there are concerning symptoms (e.g., fainting, severe dizziness, breathing problems, rapid unexplained weight change, or severe distress).