Body Fat Percentage Calculator
Body Fat Percentage Calculator
Use this Body Fat Percentage Calculator to estimate your body fat using three validated methods. Choose the option that matches your available measurements: US Navy tape measurements, Relative Fat Mass (RFM) using waist and height, or the BMI-based Deurenberg equation.
Your Details
Your Results
Body Fat % Category Ranges
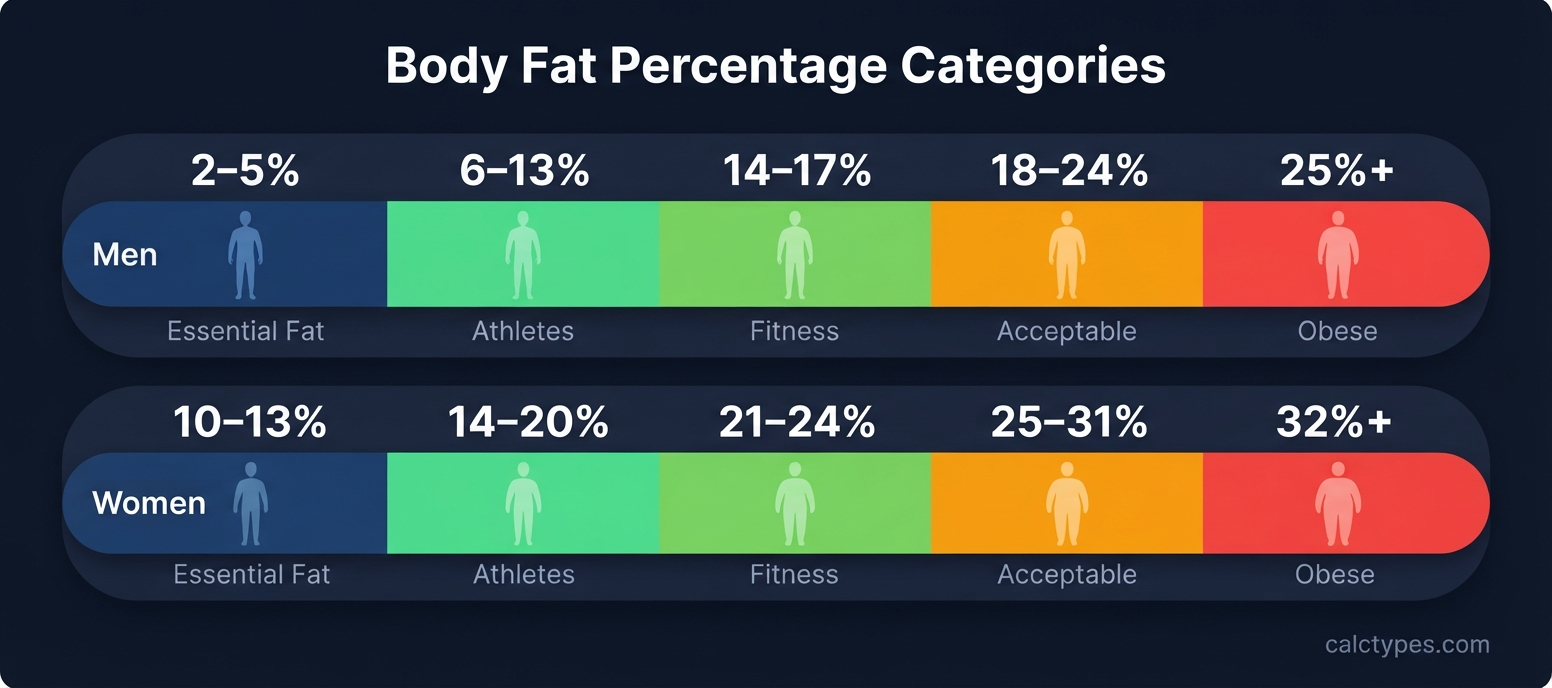
Use the table below to interpret your result. Ranges are based on widely used fitness guidelines (ACE / American Council on Exercise). Individual variation applies.
| Category | Men | Women | Notes |
|---|---|---|---|
| Essential fat | 2–5% | 10–13% | Minimum for basic physiological function |
| Athletes | 6–13% | 14–20% | Competitive sport level |
| Fitness | 14–17% | 21–24% | Active, healthy range |
| Acceptable | 18–24% | 25–31% | Average population range |
| Obese | 25%+ | 32%+ | Associated with increased health risk |
Source: American Council on Exercise (ACE). Population-based ranges, not diagnostic thresholds. Consult a healthcare professional for personal assessment.
Methodology — How Each Formula Works
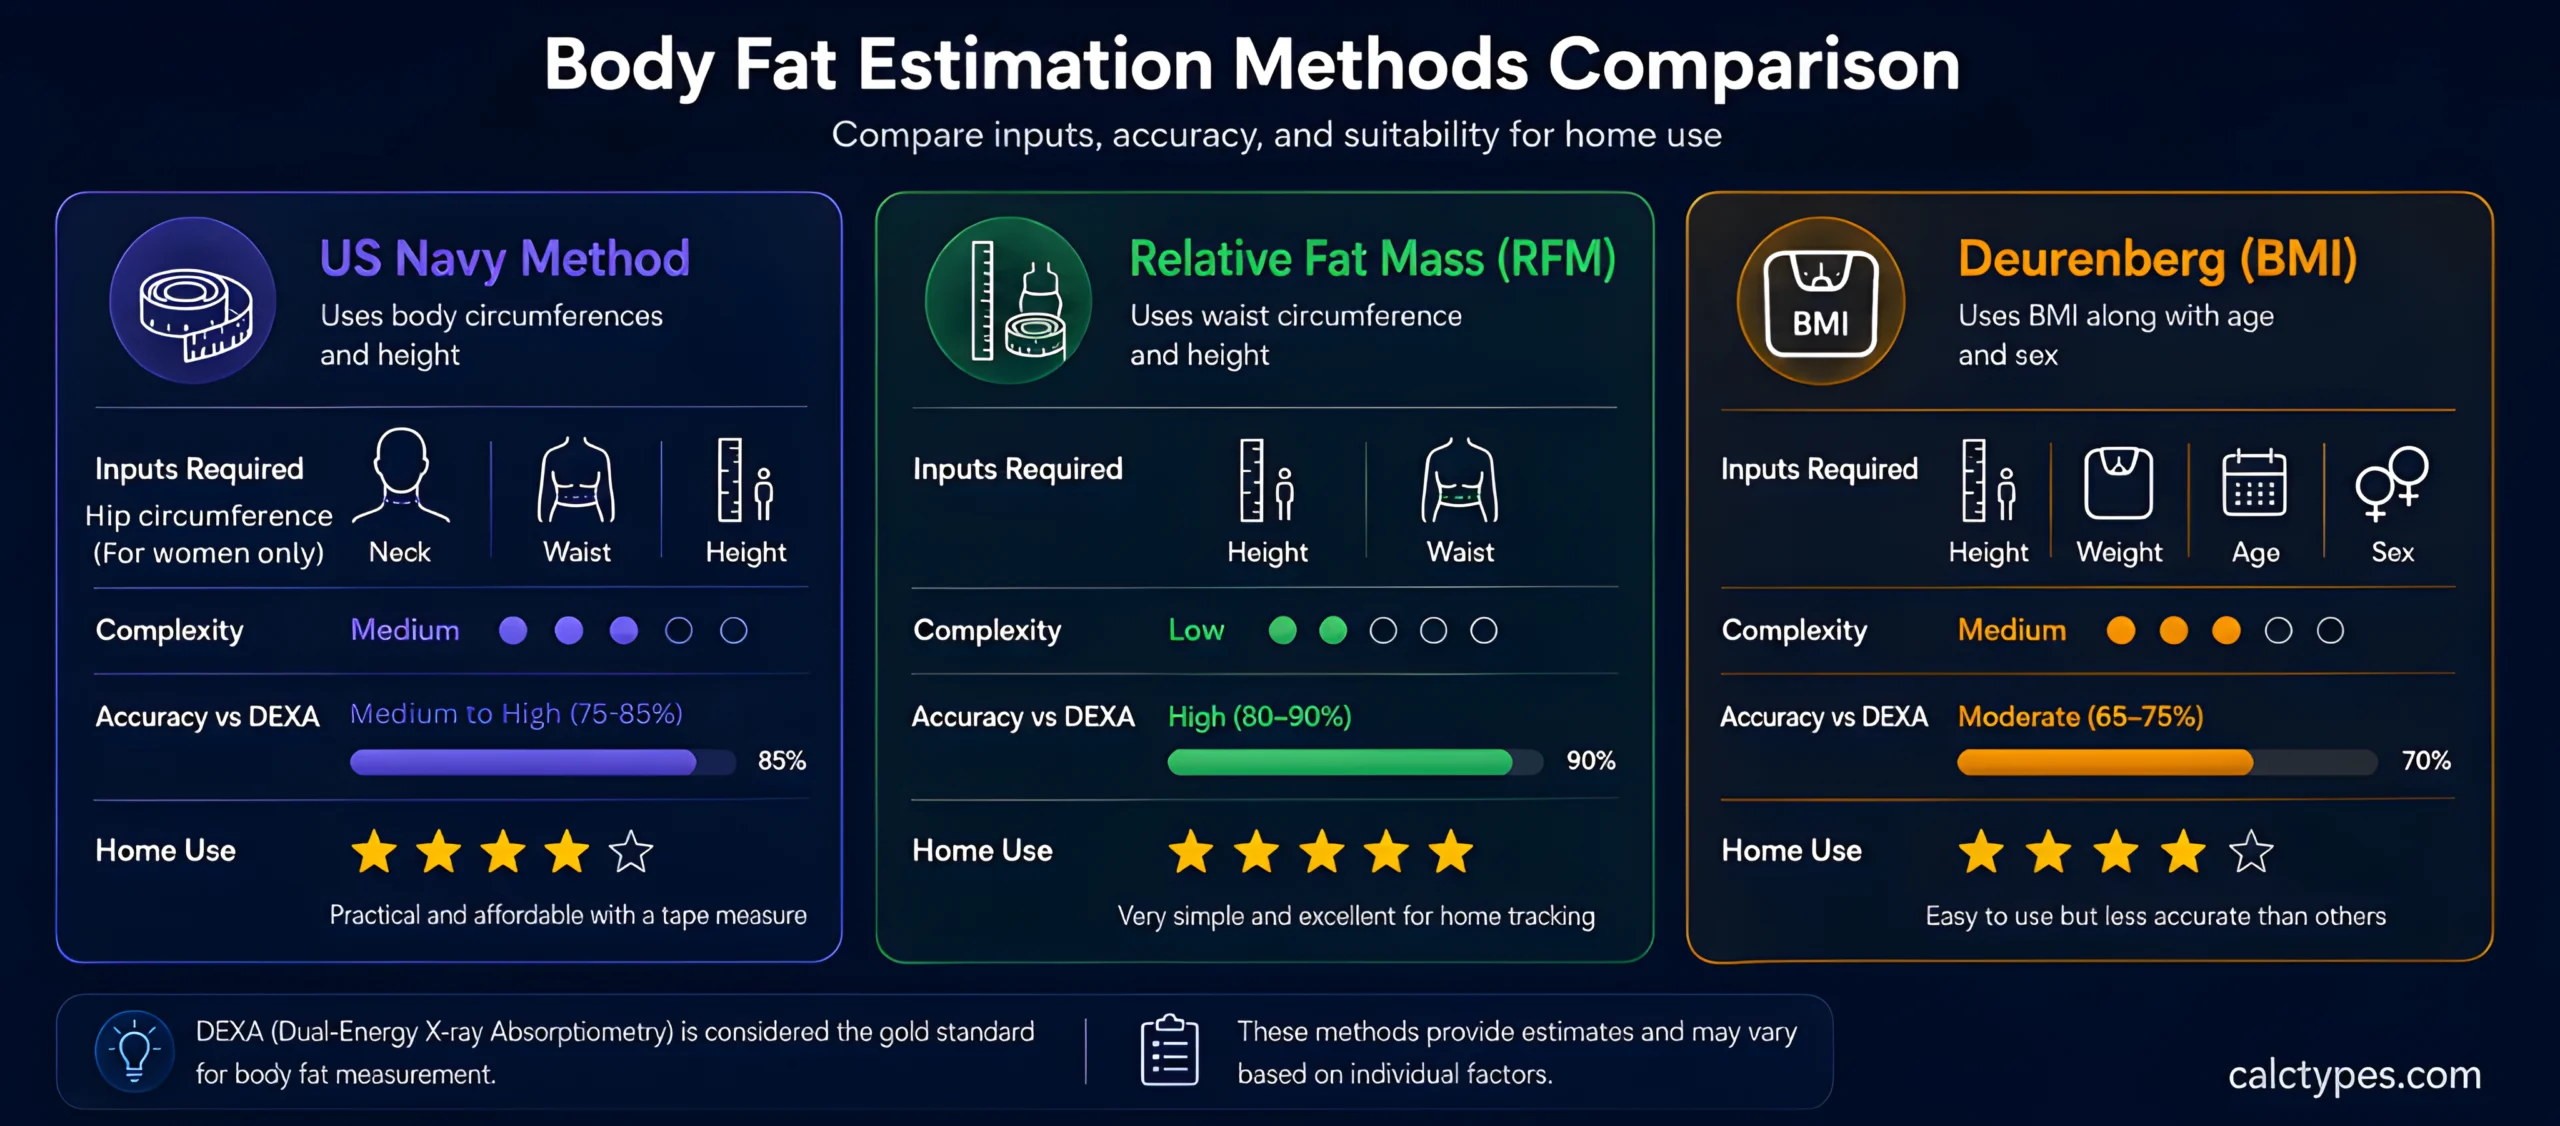
This calculator implements three peer-reviewed or widely validated estimation methods. No method matches the accuracy of DEXA scanning, but all are practical for trend-tracking.
US Navy Circumference Method
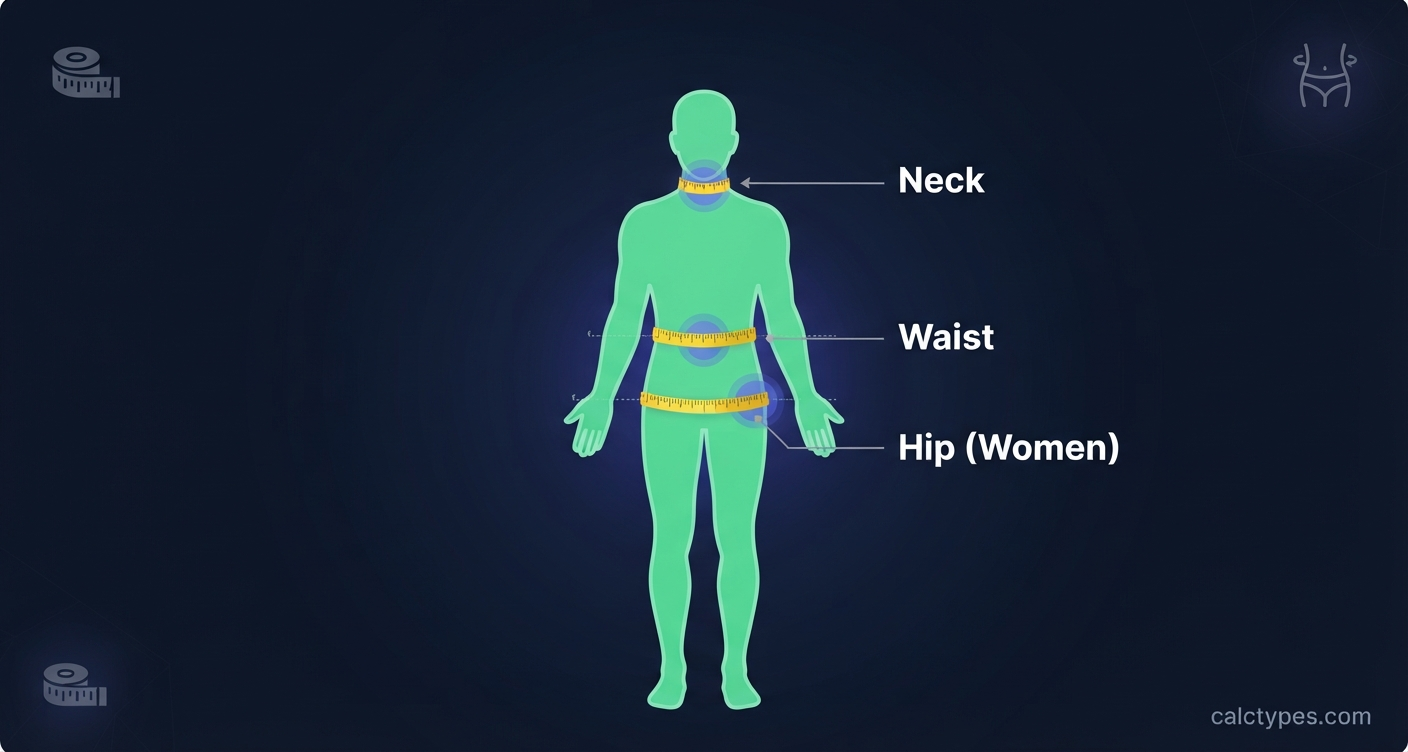
Developed by Hodgdon & Beckett (1984) at the US Naval Health Research Center. It uses circumference measurements converted to inches internally.
- Male: BF% = 86.010 × log₁₀(waist − neck) − 70.041 × log₁₀(height) + 36.76
- Female: BF% = 163.205 × log₁₀(waist + hip − neck) − 97.684 × log₁₀(height) − 78.387
Standard error of estimate: approximately 3–4%.
Relative Fat Mass (RFM)
Woolcott & Bergman (2018). Requires only waist and height — no neck measurement. Both must be in the same unit.
- Male: RFM = 64 − 20 × (height ÷ waist)
- Female: RFM = 76 − 20 × (height ÷ waist)
BMI-Based Deurenberg Equation
Deurenberg et al. (1991). Uses BMI, age, and sex; it’s population-based and can be less precise for athletes or people with very high/low muscle mass.
- BF% = 1.20 × BMI + 0.23 × age − 10.8 × sex − 5.4
- (sex: 1 = male, 0 = female; BMI = weight kg ÷ height m²)
For measurement technique and a deeper comparison, see our body fat percentage guide.
Questions People Ask
Which body fat calculator method should I use?
The right method depends entirely on what measurements you can take reliably. The US Navy method is the best all-around option if you have access to a tape measure and can measure your neck, waist, and hip (hip only required for women). It has been validated in large military populations and is widely used in fitness and health contexts. Because it uses multiple circumferences rather than BMI, it is more sensitive to changes in body composition than weight-based approaches.
The RFM (Relative Fat Mass) method is ideal if you want something even simpler — all you need is your waist and height, both in the same unit. Published in 2018, RFM was specifically designed to outperform BMI as a surrogate for body fat percentage in large populations, and it has performed comparably to more complex methods in research settings. It’s a good choice if you can’t easily measure your neck, or want a quick check without a full tape measurement session.
The Deurenberg BMI-based method is the most accessible — you need only your age, weight, and height — but it is also the least precise for individuals. BMI conflates fat mass and lean mass, meaning a muscular person may receive an overestimated body fat result while someone with low muscle mass may receive an underestimate. Use this method only when tape measurements are not possible.
Practical advice: Pick one method and stick with it. Because each method produces systematically different numbers, switching methods between measurements makes trend-tracking meaningless. Consistency of method and measurement technique matters far more than which specific formula you use.
Why do different body fat methods give different results?
Every indirect body fat estimation method is built on a mathematical model that uses proxy data — circumference measurements, BMI, or bioelectrical impedance — to predict a value that would ideally be measured directly (as with DEXA scanning or hydrostatic weighing). Because the underlying models were developed on different populations and using different reference methods, they have built-in systematic biases relative to one another. A result of 18% from the Navy method and 22% from RFM for the same person is not a contradiction — it simply reflects that the two equations model fat differently.
Beyond formula differences, measurement error is a major driver of variation. Tape placement, time of day, hydration status, and even how tightly the tape is held all affect circumference readings. Studies have shown that the same person measured by different technicians on the same day can yield Navy results varying by 2–3 percentage points. This is why self-measurement technique and consistency matter so much.
Hydration affects bioelectrical impedance (BIA) devices significantly — early morning vs. post-workout readings from a BIA scale can differ by several percentage points. Circumference-based methods like Navy and RFM are less sensitive to acute hydration changes, making them more consistent for day-to-day use.
What to do: Treat body fat % from consumer tools as a relative tracker, not an absolute truth. Measure at the same time of day, using the same method, in the same conditions, and focus on directional change over weeks and months rather than the specific number.
How do I use body fat % to calculate lean body mass and BMR?
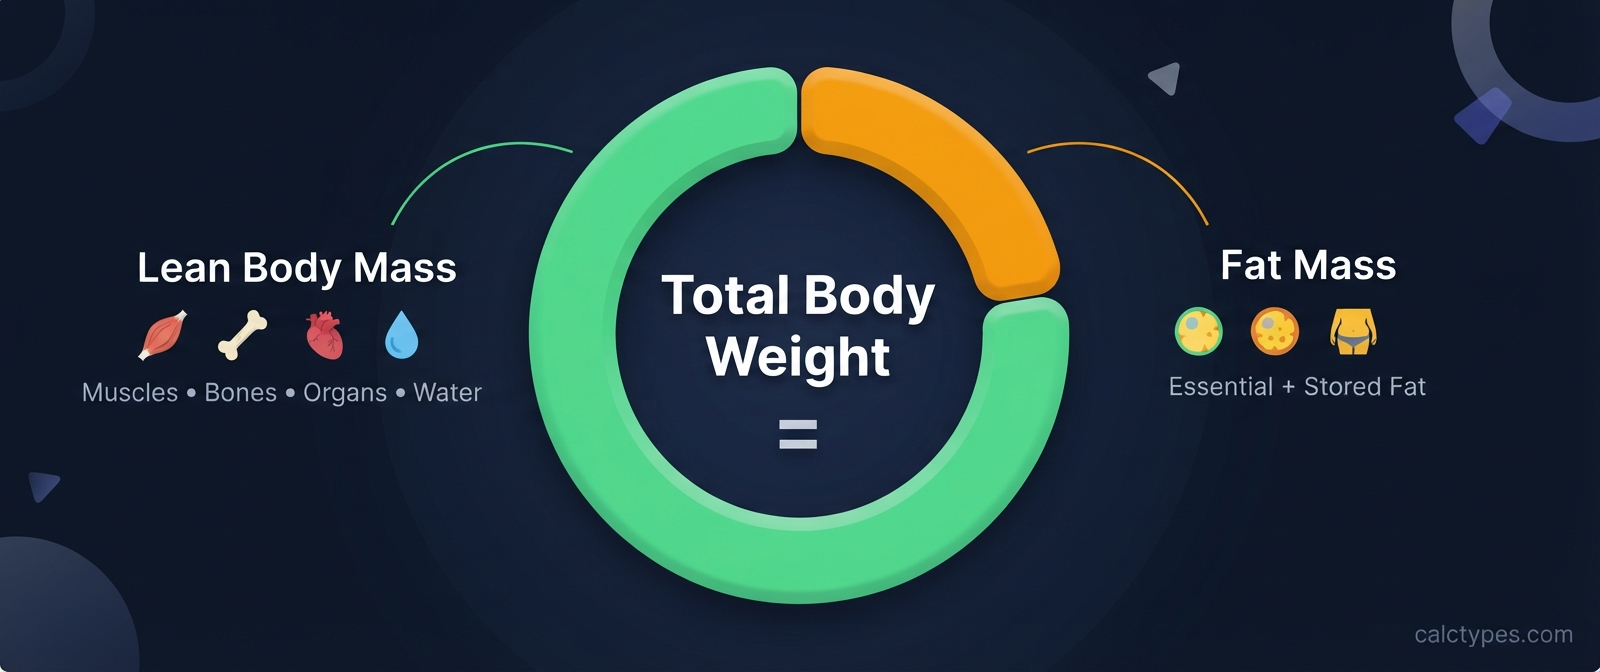
Once you have an estimated body fat percentage, you can calculate your Lean Body Mass (LBM) with a straightforward formula:
LBM = Body weight × (1 − BF% ÷ 100)
Example: 80 kg × (1 − 0.20) = 64 kg lean body mass
Lean body mass is everything in your body that is not fat — muscle, bone, organs, water, and connective tissue. It is the metabolically active portion of your body weight, which is why it matters for calorie calculations.
The Katch–McArdle BMR formula uses LBM directly rather than total body weight or height and age (as Mifflin-St Jeor does). This makes it theoretically more accurate for people with higher or lower than average muscle mass:
BMR = 370 + (21.6 × LBM in kg)
From there, multiplying by an activity factor gives you TDEE (Total Daily Energy Expenditure) — the number of calories you burn in a typical day. This is the foundation for setting calorie targets for fat loss, muscle gain, or maintenance.
Workflow: Use this calculator → feed BF% into the LBM calculator → use LBM in the Katch–McArdle BMR calculator → then adjust with activity factor via the TDEE calculator.
What is a healthy body fat percentage for men and women?
“Healthy” body fat percentage depends on sex, age, and your personal health goals. The most commonly cited ranges come from the American Council on Exercise (ACE) and are reproduced in the table above. As a quick summary:
- Men: 14–24% is broadly considered healthy (fitness to acceptable range)
- Women: 21–31% is broadly considered healthy
Why the difference between sexes? Women carry more essential fat — fat that is physiologically necessary for hormonal function, reproductive health, and other biological processes. This is not excess fat; it is required fat. Dropping below 10–13% for women (or below 2–5% for men) can impair hormone production, immune function, and bone density.
Age matters too. Body fat naturally increases with age even if body weight stays the same, because lean muscle mass tends to decline (sarcopenia). A 50-year-old at 22% body fat may be in a healthier state than a 25-year-old at the same percentage, depending on muscle distribution.
Beyond the number: Body fat percentage alone does not tell you whether fat is distributed safely. Visceral fat (stored around organs) carries more health risk than subcutaneous fat (stored under the skin). Waist circumference and waist-to-height ratio are useful complementary indicators for abdominal fat risk.
These ranges are population averages. For individual health assessment, consult a qualified healthcare professional.
How accurate is the Navy body fat calculator compared to DEXA?
DEXA (Dual-Energy X-ray Absorptiometry) is considered the practical gold standard for body composition measurement in clinical and research settings. It directly measures bone mineral density, lean tissue, and fat tissue using low-dose X-ray. Its standard error in trained settings is approximately 1–2%.
The US Navy method has a reported standard error of estimate (SEE) of approximately 3.5–4% body fat compared to underwater weighing (hydrostatic weighing), which was the gold standard at the time of the original research. When compared directly to DEXA in more recent studies, accuracy varies — particularly at the extremes of body composition (very lean or very obese individuals), where circumference-based methods tend to be less accurate.
RFM vs DEXA: Woolcott & Bergman (2018) showed that RFM had a stronger correlation with DXA-measured body fat than BMI in a large nationally representative US sample (NHANES data). RFM also showed less systematic bias across sex, age, and ethnicity compared to BMI-based approaches.
Practical takeaway: For consumer home use, the Navy and RFM methods are among the best available without specialist equipment. Expect absolute accuracy of ±3–5% compared to DEXA. For trend tracking over months — which is what most people actually need — these methods work very well when applied consistently. If you need clinical-grade body composition data, arrange a DEXA scan.
Sources & References
- Woolcott OO, Bergman RN. Relative Fat Mass (RFM) as a new estimator of whole-body fat percentage. Scientific Reports, 2018.
- Deurenberg P, Weststrate JA, Seidell JC. Body mass index as a measure of body fatness: age- and sex-specific prediction formulas. British Journal of Nutrition, 1991.
- Hodgdon JA, Beckett MB. Prediction of percent body fat for US Navy men from body circumferences and height (1984). Via DTIC.
Limitations
- Estimation error: All methods are estimates; typical error can be ±3–5% vs DEXA (the practical gold standard).
- Reduced accuracy at extremes: Very lean or very high body-fat individuals may see larger deviations from all three formulas.
- Method-dependent variation: Navy, RFM, and Deurenberg use different inputs and will not produce identical results for the same person.
- Measurement sensitivity: Tape placement, tension, hydration, and time of day can shift circumference-based results by several percentage points.
- Not population-validated for every group: Original formulas were derived from specific reference populations and may be less precise for athletes, older adults, or non-adult users.
Disclaimer
This calculator is provided strictly for general educational and informational purposes. It is not a medical device, and its results do not constitute medical advice, diagnosis, or treatment of any kind.
- Do not use these results to diagnose, treat, or manage any medical condition.
- Do not use these results for military, occupational, insurance, or any official compliance/clearance requirement.
- Body fat estimation carries inherent error margins and should never replace clinical assessment (e.g., DEXA scan, physician evaluation).
- If you are pregnant, under 18, elderly, or managing a medical condition, consult a qualified healthcare professional before acting on these results.
- CalcTypes and its content reviewers accept no liability for decisions made based on this tool’s output.