BMR Formula Comparison: Mifflin–St Jeor vs Harris–Benedict vs Katch–McArdle
BMR Formula Comparison: Katch–McArdle vs Mifflin–St Jeor vs Harris–Benedict
A practical, educational comparison of the three most common BMR equations—what they need, when they fit best, and why results differ. For calculations, use the linked calculators at the bottom of this page.
Review
Department of Pathology, Aligarh Muslim University (A.M.U.), Aligarh
Reviewed this educational comparison for appropriate framing of BMR concepts, limitations, and safe interpretation. No diagnostic or treatment claims are made.
On this page
Quick takeaway
If you want the simplest, most broadly useful estimate, start with Mifflin–St Jeor. Use Katch–McArdle when your body fat % (and therefore lean body mass) is measured consistently and is “good enough.” Keep revised Harris–Benedict as a strong comparison formula—then calibrate using real-world trends over 2–4 weeks.
Quick chooser: which BMR formula should you use?
- Don’t know body fat %? Start with Mifflin–St Jeor.
- Know body fat % reasonably well? Consider Katch–McArdle (LBM-based).
- Want a classic comparison? Use Harris–Benedict (revised).
Comparison table
| Formula | Inputs required | Best fit (practical) | Main limitation |
|---|---|---|---|
| Mifflin–St Jeor | Sex, age, height, weight | Most adults without body fat % data | Doesn’t directly account for lean mass differences |
| Harris–Benedict (revised) | Sex, age, height, weight | Classic comparison option | May differ vs MSJ depending on body type; still population-based |
| Katch–McArdle | Weight + body fat % (to estimate LBM) | When body fat % is reasonably accurate | Very sensitive to body fat % measurement error |
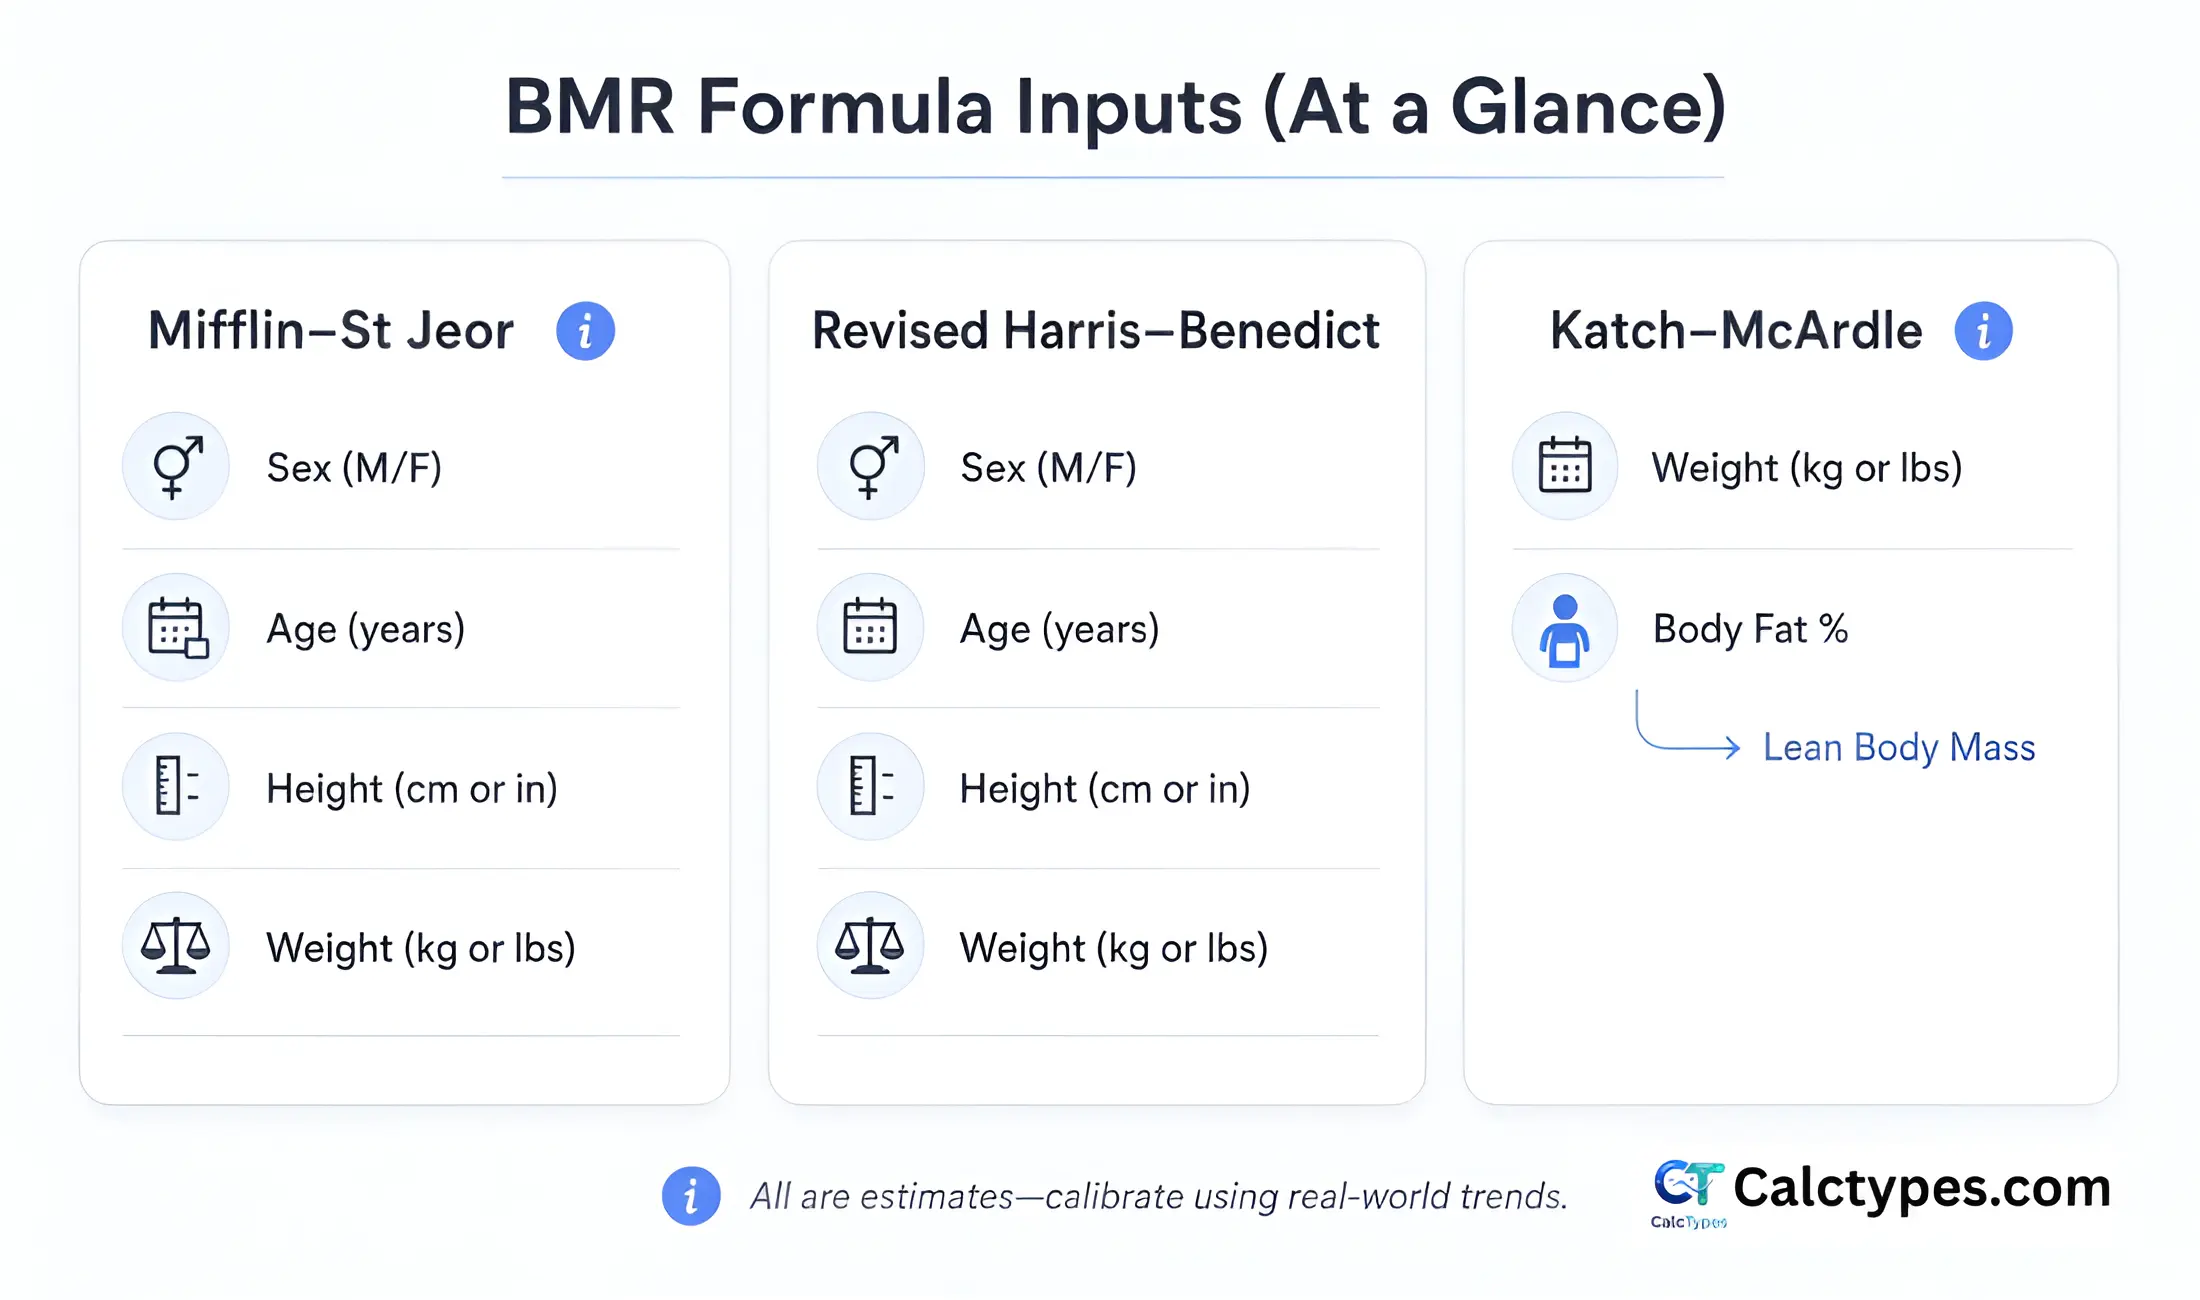
Most accurate BMR formula: which one is best?
“Most accurate” depends on what you mean by accuracy. These equations do not measure your metabolism; they predict an expected resting energy expenditure based on a limited set of inputs. In real life, two people with the same height, weight, age, and sex can still have different resting needs because of differences in lean mass, genetics, sleep, illness, medications, and recent dieting history.
In practice, Mifflin–St Jeor is often the best default because its inputs are easy to measure and repeat. Katch–McArdle can be a better “fit” when your lean body mass estimate is reliable (consistent body fat % method). Revised Harris–Benedict is useful as a comparator—if MSJ and HB are close, you can be more confident; if they diverge, treat the range as a planning band and calibrate with trends.
A realistic way to choose
- Pick a starting equation you can measure consistently (often MSJ).
- Use it to set an initial calorie target.
- Adjust based on 2–4 weeks of outcomes rather than chasing “perfect” one-day numbers.
BMR vs RMR: what’s the difference?
People often use BMR and RMR interchangeably, but they’re not identical. BMR is typically defined as energy expenditure at complete rest under stricter conditions (fasted, rested, thermoneutral environment). RMR (resting metabolic rate) is measured under less strict “resting” conditions and is often slightly higher. Many online “BMR calculators” are effectively providing a resting estimate that behaves like an RMR starting point in real-world planning.
The practical takeaway: whether you call it BMR or RMR, it’s still a baseline estimate. What matters is how you use it—typically by moving from a resting estimate to a daily maintenance estimate (TDEE) and then calibrating using real outcomes.
Want the strict definitions and practical examples? See BMR vs RMR.
Why BMR results differ between formulas
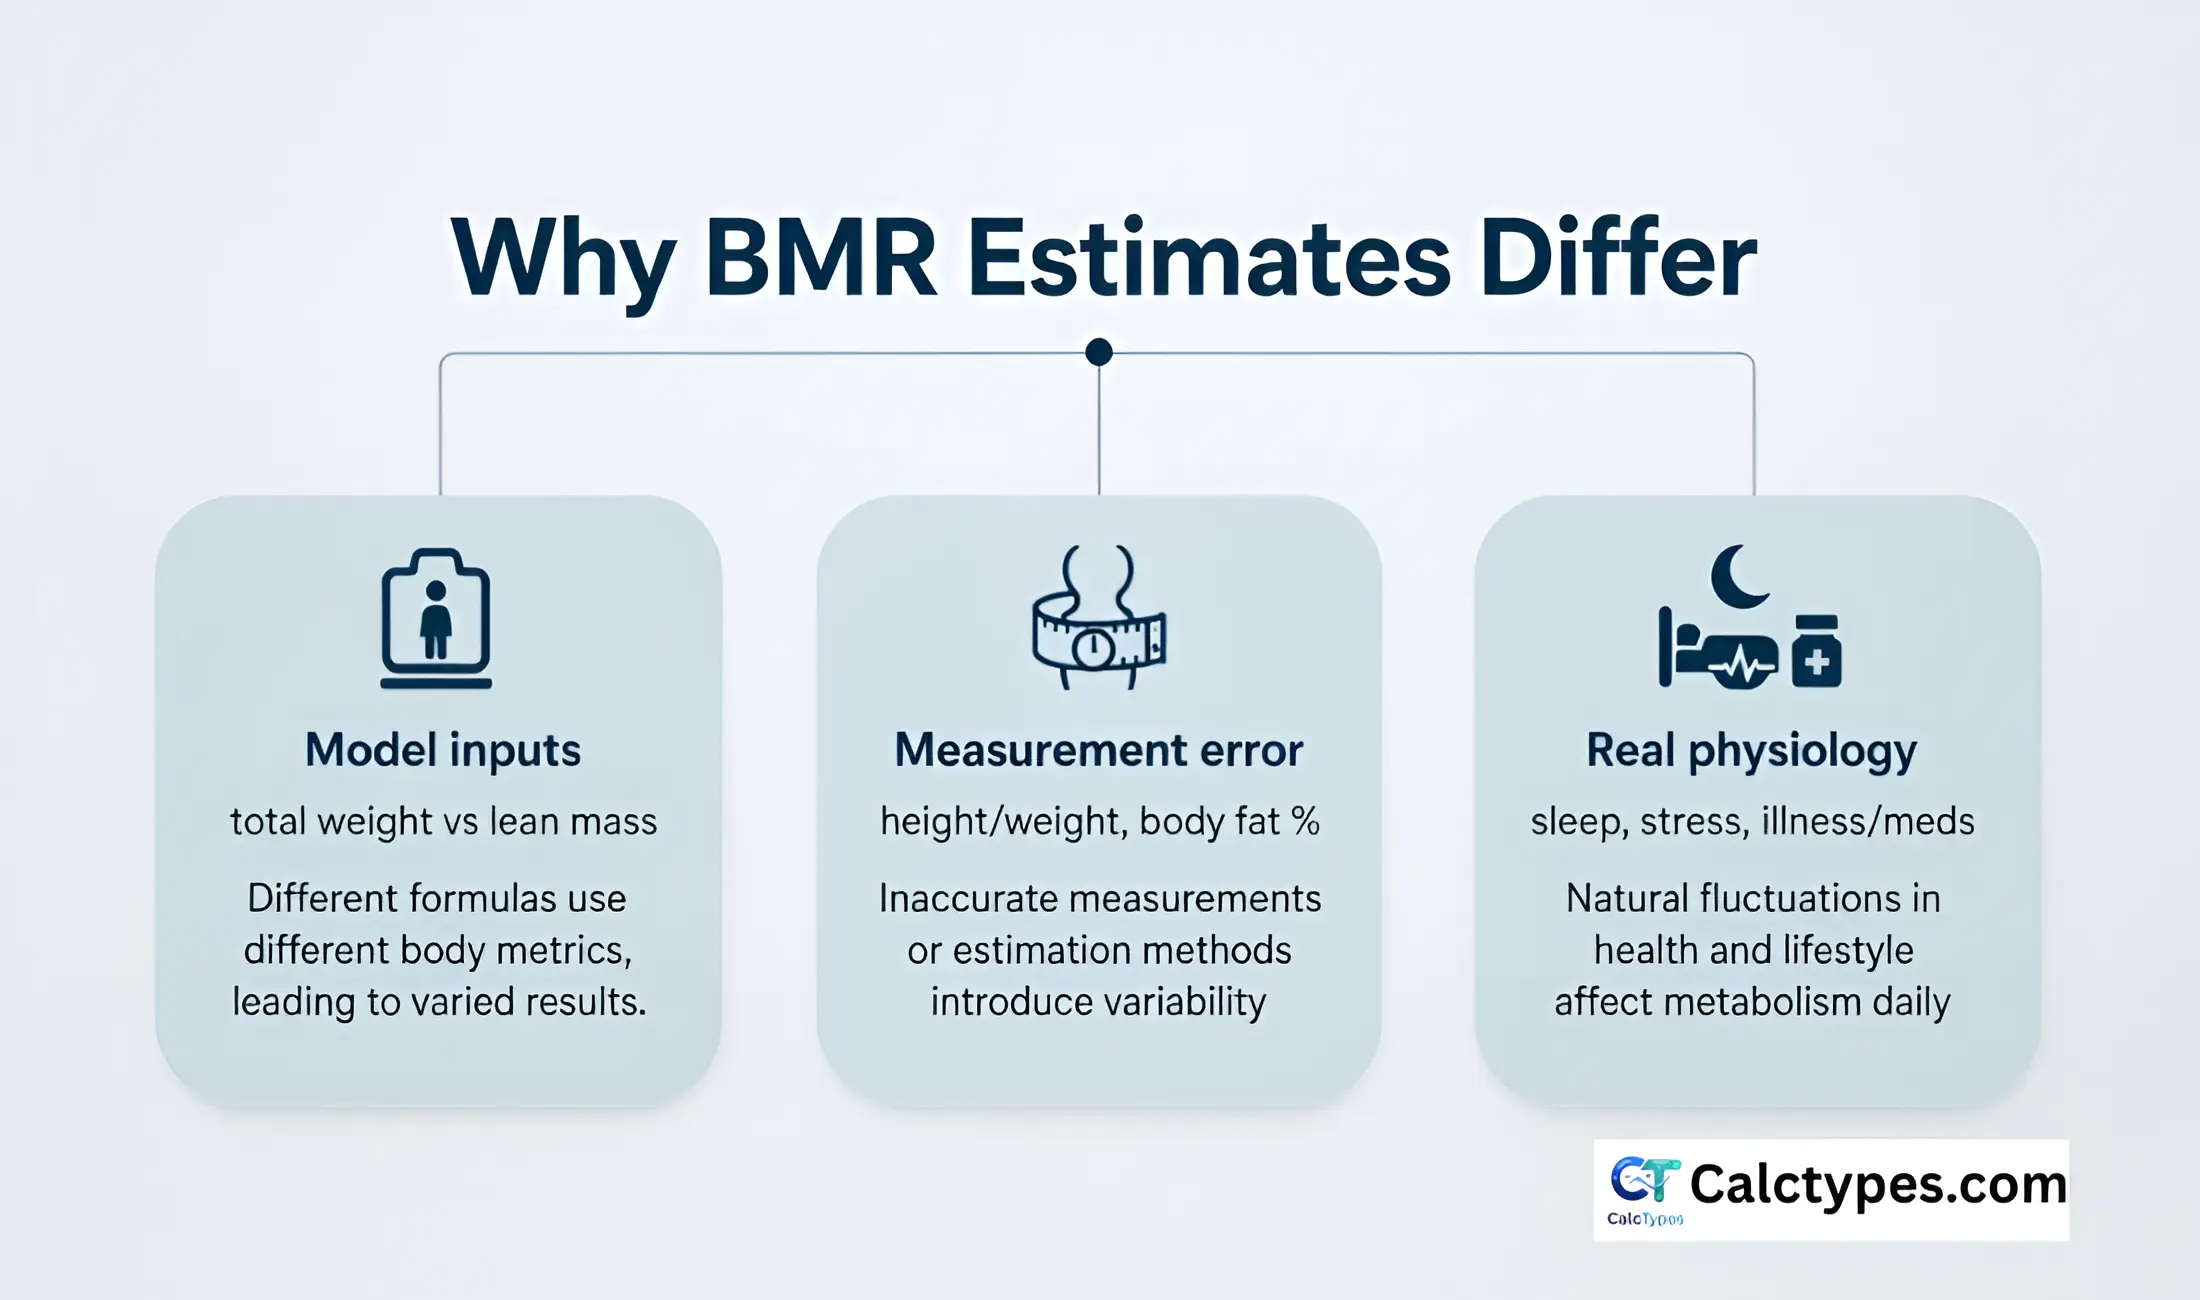
These equations were built from different study populations and different model assumptions. Some use total weight; Katch–McArdle uses lean body mass. Even if two formulas are “good,” they can still produce different numbers for the same person.
- Body composition: People with higher lean mass often have higher resting energy needs.
- Measurement inputs: Height/weight errors and especially body fat % errors change results.
- Real-world factors: sleep, stress, medications, and health conditions can shift energy needs.
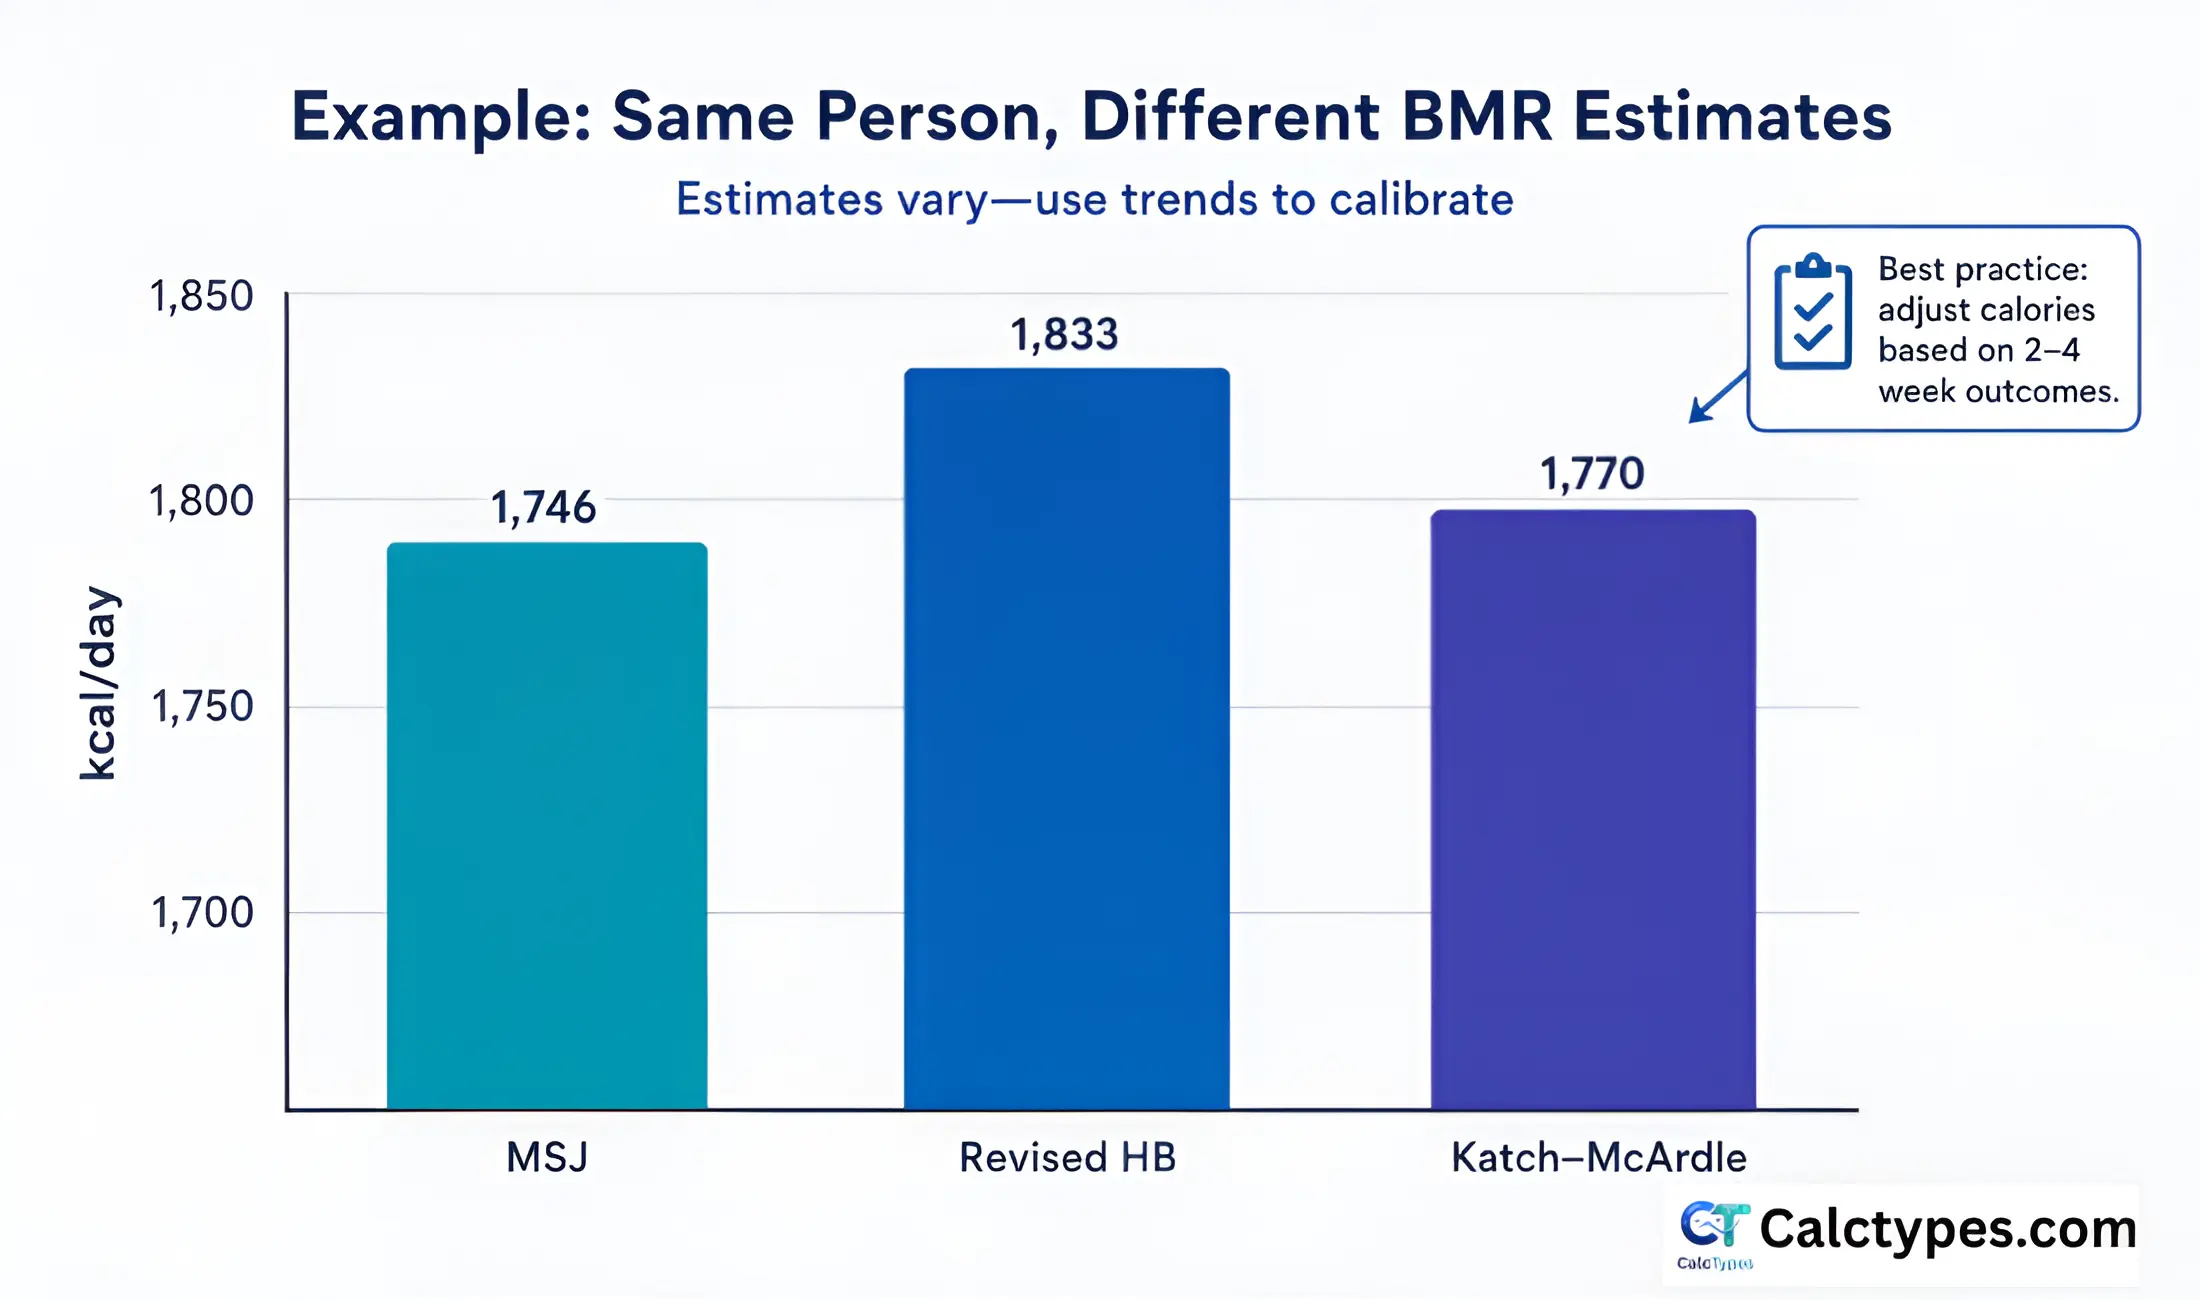
Same person, three formulas (example)
Example person: male, 81 kg, 173 cm, 30 years. Katch–McArdle also needs body fat %; if we assume 20% body fat, LBM = 64.8 kg. Run the exact numbers in the calculators for your situation: BMR calculator. If you prefer to verify by hand, see how to calculate BMR manually.
- Mifflin–St Jeor: estimate based on weight/height/age/sex.
- Harris–Benedict (revised): classic alternative estimate.
- Katch–McArdle: estimate based on lean mass (LBM).
How to use BMR to estimate maintenance calories (TDEE) or weight loss calories
A BMR estimate is not a daily calorie target by itself. It’s a baseline. To plan food intake, most people approximate a daily maintenance range by applying an activity multiplier (or by using a TDEE workflow), then adjust based on results. If you jump straight from a BMR number to a large deficit, you can end up under-eating—especially if your activity level is high or your BMR estimate is on the low side for your body composition.
A practical 3-step workflow
- Start: choose a BMR equation you can measure consistently (often MSJ).
- Estimate: convert it to a daily maintenance band (TDEE-style) using your typical activity pattern.
- Calibrate: track 2–4 weeks and adjust gradually based on weekly weight average, waist, hunger, sleep, and performance.
Questions people ask
Is Katch–McArdle more accurate than Mifflin–St Jeor?
It can be more useful if body fat % is reasonably accurate, because it estimates BMR from lean body mass. But if body fat % is off, the result can be off. If you don’t know body fat %, Mifflin–St Jeor is usually the better default.
The reason is sensitivity: Katch–McArdle uses lean body mass (LBM), and LBM is calculated from body fat %. If your body fat % estimate swings due to hydration, device variability, or inconsistent measurement timing, your BMR estimate will swing as well. By contrast, MSJ relies on weight/height/age/sex—inputs that are typically more repeatable. A formula with slightly less “individualization” but more consistent inputs often performs better for planning because it gives you a stable starting point that you can calibrate with trends.
Practical example: if you weigh 81 kg, and your body fat estimate is 20%, LBM is 64.8 kg. If the real value is closer to 25%, LBM would be 60.75 kg—enough to change the Katch–McArdle estimate meaningfully. That’s why Katch–McArdle is best when body fat % measurement is consistent and “good enough,” not when it’s random.
Which formula should I use if I lift weights or have high muscle mass?
If you lift weights or have above-average muscle mass, Katch–McArdle can sometimes better reflect resting needs—because it keys off lean body mass rather than total scale weight. However, that benefit only appears when your body fat % estimate is stable and plausible. If your body fat % method is noisy, the “LBM advantage” can become false precision.
A reliable strategy is to compute MSJ and revised Harris–Benedict, treat the two outputs as a reasonable band, and then calibrate using performance and bodyweight trends. If you’re maintaining strength and your weekly weight average is stable, you’re likely near maintenance—regardless of which formula you chose. If weight is drifting and performance is dropping, adjust gradually rather than switching equations repeatedly.
Do these formulas measure metabolism?
No. They estimate resting energy needs from inputs. Lab-based indirect calorimetry is a more direct measurement method.
The most useful way to think about BMR equations is “starting estimates.” They’re not diagnoses and they’re not tailored to every variable that affects energy expenditure (sleep debt, recent dieting, illness, medications, hormonal changes, etc.). That’s why trend-based calibration over multiple weeks is the safest way to use any BMR output for planning.
Sources
Methodology
This page is an educational comparison of three commonly used BMR equations. We summarized each formula’s required inputs, practical use cases, and major limitations based on the original publications for Mifflin–St Jeor and revised Harris–Benedict, plus standard exercise physiology references for Katch–McArdle usage. The worked example shows how outputs can differ for the same person when inputs are held constant.
Best practice is to validate any calorie target against real-world trends over multiple weeks.
Limitations
These formulas provide planning estimates, not medical measurements. They do not diagnose metabolic conditions and should not be used for diagnosis, treatment, or compliance decisions. If you have symptoms or medical concerns (e.g., unexplained weight changes, fatigue, suspected endocrine issues), consult a qualified clinician. For site-wide policy, see: calctypes.com/disclaimer.