Harris Benedict BMR Calculator (Revised Equation)
Harris–Benedict (Revised) BMR Calculator
Use this Harris Benedict BMR calculator to estimate your basal metabolic rate (BMR) using the revised Harris–Benedict equation. Results are a planning estimate (not a lab measurement). If you want to compare formulas, use the main BMR calculator.
Compare with Mifflin–St Jeor or try an LBM-based option like Katch–McArdle. For maintenance planning, use the TDEE calculator.
Content review
Calculator
Your Details
Your Results
Enter your details to calculate BMR.
Assumptions & warnings
Share, download, print
Report an issue
If something looks wrong, send details and (if possible) the share link you generated.
Before you use this number
BMR is a starting point, not a prescription
Your BMR estimate is a planning baseline for “resting” energy needs. Your real daily needs can be higher or lower depending on movement, sleep, illness, medications, and body composition.
If you’re wondering what counts as a “good” BMR and what factors shift it, see what is a good BMR.
If you’re using this for weight change, a safer approach is gradual adjustments and trend-based monitoring. Read the full disclaimer.
On this page
Visuals
Chart
BMR vs maintenance (visual)
If you select an activity level, the chart compares BMR to your activity-adjusted maintenance estimate.
Calculation steps
Step-by-step math (auto-updates)
Steps update automatically based on your inputs.
Detailed breakdown
Inputs and outputs
| Parameter | Value |
|---|---|
| Enter your details to see the breakdown. | |
Embed this calculator
Copy embed code
Embed includes an iframe and attribution.
Embed code will be generated by the button below.
How to use
Quick steps
- Select Metric or US units.
- Enter age, sex, weight, and height.
- (Optional) choose activity level to estimate maintenance calories.
- Use the steps and breakdown to double-check inputs and conversions.
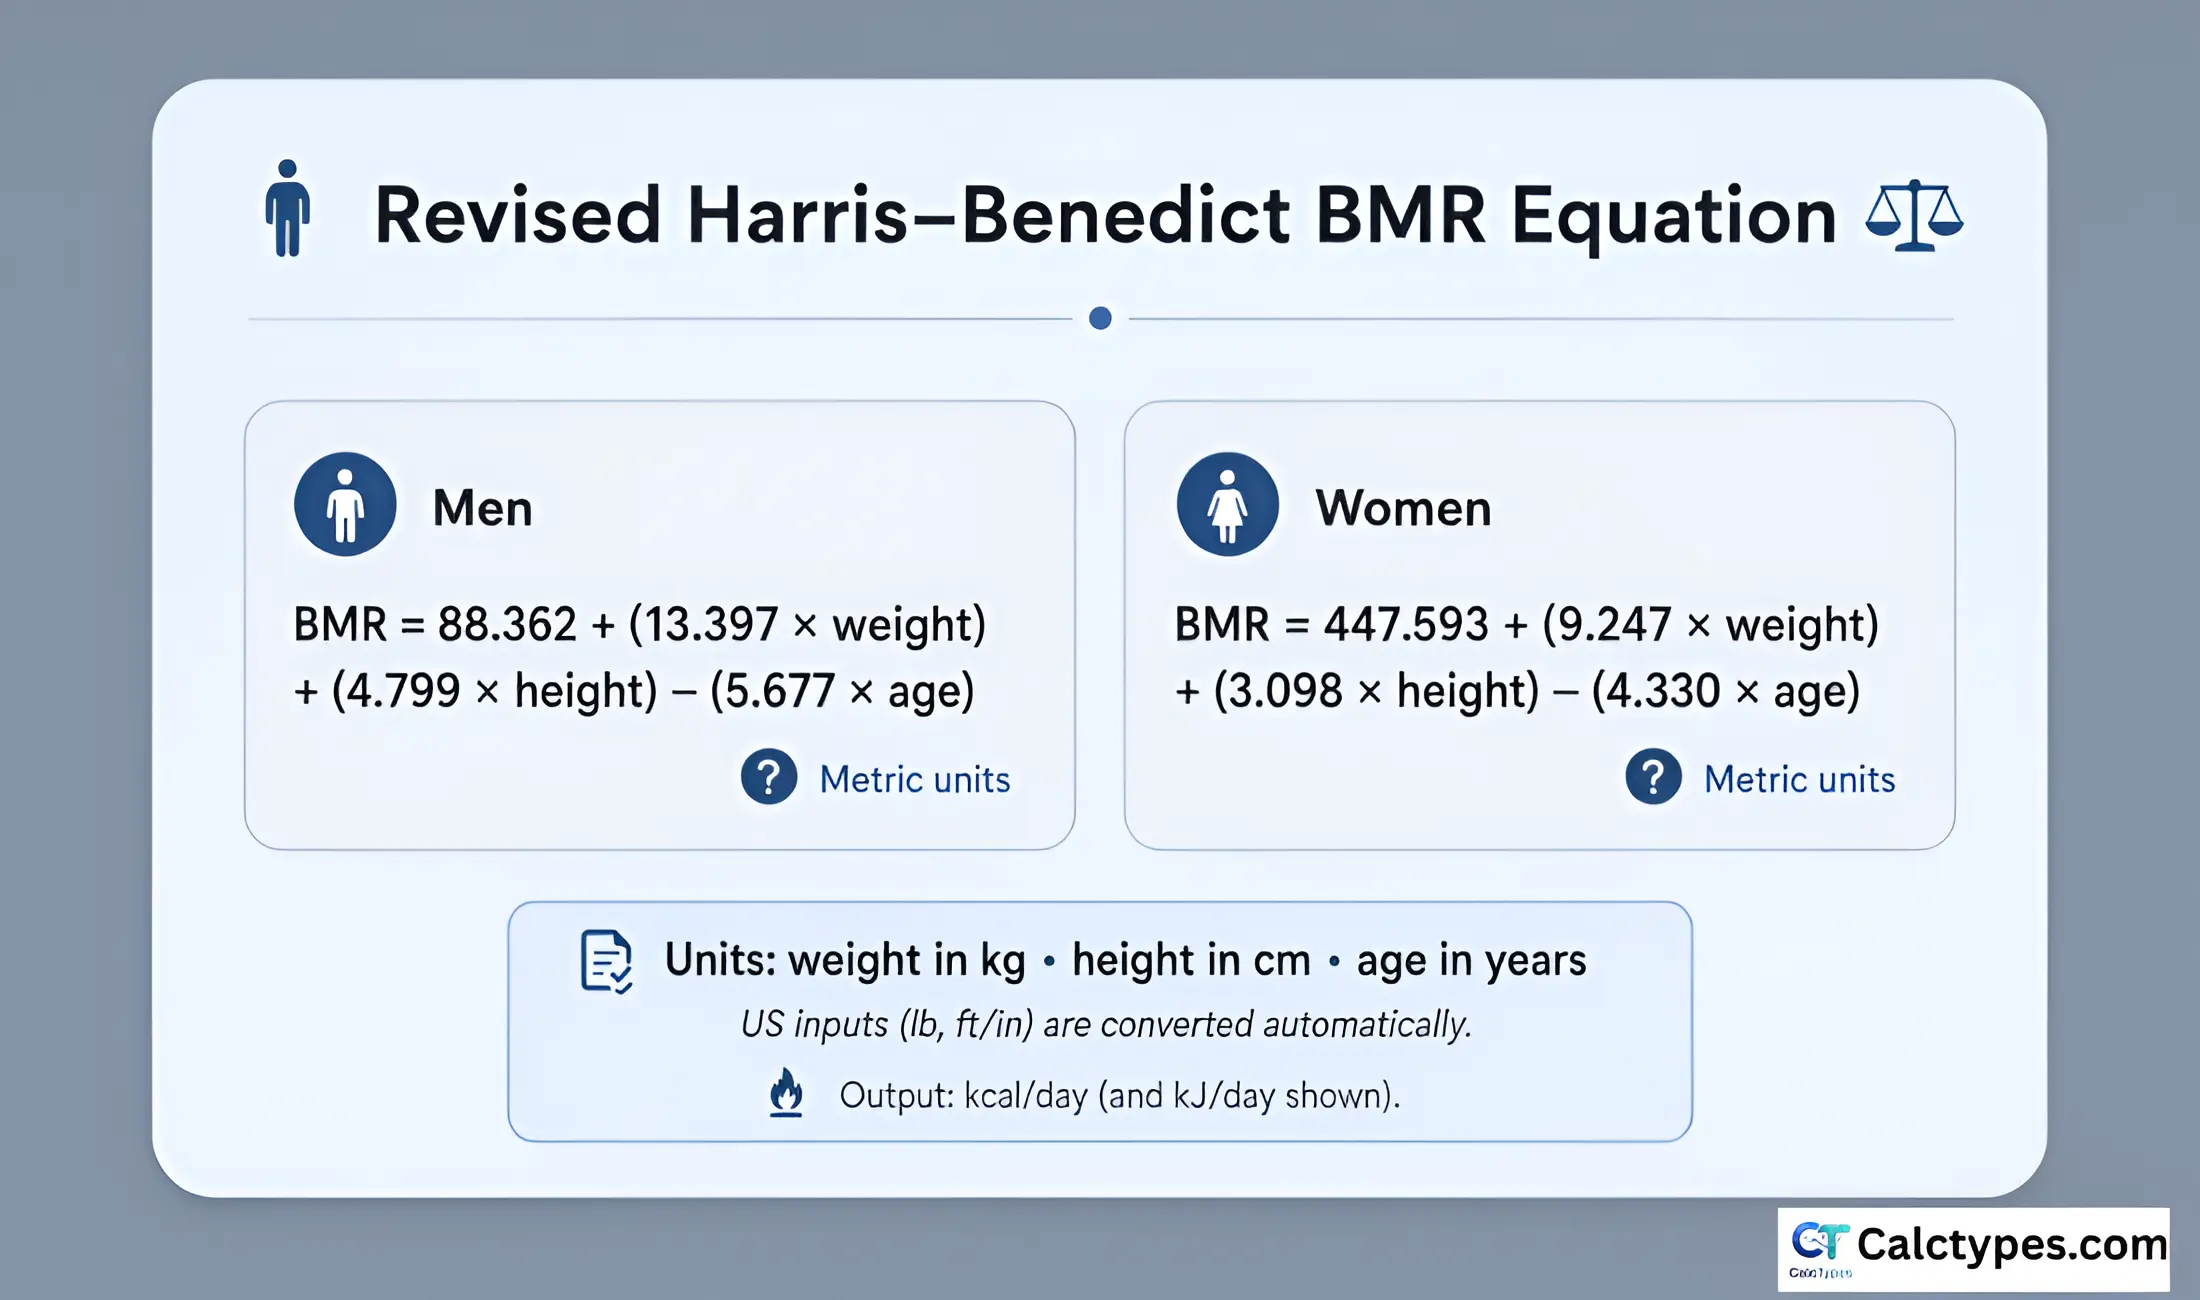
Harris–Benedict Equation (Revised)
Men
BMR = 88.362 + (13.397 × W) + (4.799 × H) − (5.677 × A)
88.362 + (13.397 × 80) + (4.799 × 178) − (5.677 × 30)
= 88.362 + 1,071.76 + 854.222 − 170.31
= ≈ 1,844 kcal/day
Women
BMR = 447.593 + (9.247 × W) + (3.098 × H) − (4.330 × A)
447.593 + (9.247 × 65) + (3.098 × 163) − (4.330 × 28)
= 447.593 + 601.055 + 504.974 − 121.24
= ≈ 1,432 kcal/day
What each coefficient means
| Variable | Men coefficient | Women coefficient | What it does |
|---|---|---|---|
| Weight (W, kg) | +13.397 | +9.247 | Higher body weight increases the BMR estimate. |
| Height (H, cm) | +4.799 | +3.098 | Taller height increases the BMR estimate. |
| Age (A, years) | −5.677 | −4.330 | Older age reduces the estimate. |
| Intercept | 88.362 | 447.593 | Baseline constant in the regression model. |
These coefficients describe population averages. Individual BMR can differ based on lean mass, hormones, sleep, medications, and health conditions.
If you want to reproduce the math without a tool, see how to calculate BMR manually.
Understanding BMR
What BMR means (definition you can actually use)
Basal Metabolic Rate (BMR) is an estimate of how much energy your body uses in a day to keep you alive at complete rest—breathing, circulation, temperature regulation, and basic organ function. It’s often described as “calories burned doing nothing,” but it’s better to think of it as a baseline: a starting point for planning, not a precise measurement of your metabolism.
The revised Harris–Benedict equation gives you that baseline using age, sex, height, and weight. Those inputs are easy to measure consistently, which is why Harris–Benedict remains popular. The tradeoff is that two people with the same inputs can still have different real resting needs (for example, because of lean mass differences, health conditions, medications, or recent dieting).
BMR vs TDEE (maintenance calories): why people feel “the number is wrong”
Many users expect a BMR calculator to output “how many calories I should eat.” That expectation is the #1 reason results feel too low. BMR is resting needs; most people maintain weight at a higher number because daily life includes movement (NEAT), exercise, and digestion. That’s why this calculator also estimates maintenance using an activity multiplier.
Practical example: if your BMR is 1,600 kcal/day and your routine is moderately active, a simple estimate might place maintenance closer to 2,300–2,500 kcal/day. If you tried to eat at 1,600 while also training, you’d likely create a large deficit—even if you “only wanted” a small one. This doesn’t mean the equation is perfect; it means you’re comparing a resting baseline to a daily-living target.
Why different BMR formulas disagree (and when Harris–Benedict is a good choice)
Harris–Benedict and Mifflin–St Jeor both use total body weight, height, age, and sex. Katch–McArdle attempts to account for lean body mass (LBM), which can be useful if body fat % is measured consistently. In real use, Harris–Benedict is a good choice when you want a stable, repeatable estimate without relying on body fat % inputs that can be noisy (especially from consumer BIA scales).
A smart workflow is to treat the BMR result as a baseline, then validate it against trend data over 2–4 weeks. If your “maintenance” estimate causes steady gain, it’s too high for you; if it causes steady loss, it’s too low. Trend-based calibration is the bridge between equations and reality.
Worked examples
Worked example 1 (male): 81 kg, 173 cm, 30 years
Choose the men’s equation, then substitute W=81, H=173, A=30 and compute each term. This matches the calculator’s step-by-step panel.
13.397 × 81 = 1,085.157
4.799 × 173 = 830.227
5.677 × 30 = 170.310
Total:
BMR = 88.362 + 1,085.157 + 830.227 − 170.310 = ≈ 1,833 kcal/day
kJ/day = 1,833 × 4.184 = ≈ 7,669 kJ/day
If moderately active (×1.55), estimated maintenance ≈ 1,833 × 1.55 ≈ 2,841 kcal/day.
Worked example 2 (female): 65 kg, 163 cm, 28 years
Use the women’s equation, substitute W=65, H=163, A=28, compute each term, then sum. The calculator uses the same logic and rounds for readability.
9.247 × 65 = 601.055
3.098 × 163 = 504.974
4.330 × 28 = 121.240
Total:
BMR = 447.593 + 601.055 + 504.974 − 121.240 = ≈ 1,432 kcal/day
kJ/day = 1,432 × 4.184 = ≈ 5,991 kJ/day
If lightly active (×1.375), estimated maintenance ≈ 1,432 × 1.375 ≈ 1,969 kcal/day.
Accuracy & interpretation
How to interpret the estimate
Predictive equations can be off for individuals. Use this as a baseline, then adjust based on real-world trend data (body weight trend, appetite, training performance, and health context).
Limitations (important)
Where Harris–Benedict can mislead
- It does not directly account for body composition differences.
- It is a predictive estimate, not a lab measurement.
- Illness, pregnancy, medications, and endocrine conditions can change energy needs.
Methodology
Equation used (revised Harris–Benedict)
Men: BMR = 88.362 + (13.397×weight) + (4.799×height) − (5.677×age)
Women: BMR = 447.593 + (9.247×weight) + (3.098×height) − (4.330×age)
Weight in kg, height in cm, age in years (US inputs are converted automatically).
Questions people ask
Harris–Benedict vs Mifflin–St Jeor: which BMR formula is more accurate?
Harris–Benedict vs Mifflin–St Jeor: which BMR formula is more accurate?
Both formulas estimate BMR from weight, height, age, and sex — but they were developed in different eras on different populations and produce meaningfully different results, especially at higher body weights.
Harris–Benedict (Revised, 1984): Originally developed in 1919 on approximately 239 subjects and revised by Roza and Shizgal in 1984 using a larger dataset and updated regression methods. It was the dominant clinical and research equation for decades. It tends to overestimate BMR more frequently than Mifflin–St Jeor, particularly in overweight and obese individuals. It typically produces results 5–10% higher than Mifflin–St Jeor at higher body weights.
Mifflin–St Jeor (1990): Developed on a broader, more contemporary sample with a wider BMI range. A landmark 2005 systematic review by Frankenfield, Roth-Yousey, and Compher (Journal of the American Dietetic Association) found Mifflin–St Jeor predicted measured RMR within 10% of true values approximately 82% of the time in non-obese adults — the best performance of any commonly used equation in that comparison.
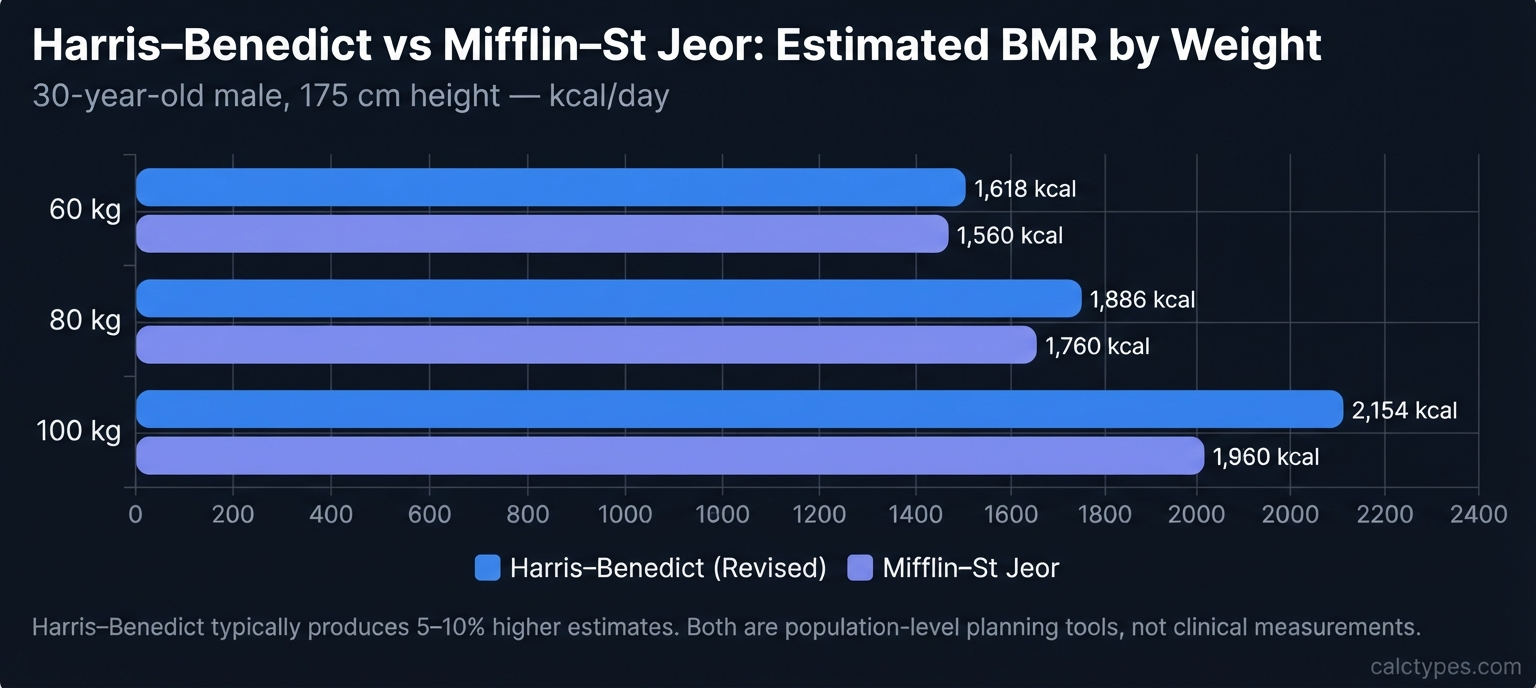
Grouped bar chart comparing Harris–Benedict and Mifflin–St Jeor BMR estimates at 60kg 80kg and 100kg for a 30-year-old male 175cm
Harris–Benedict consistently produces slightly higher BMR estimates than Mifflin–St Jeor. The gap grows at higher body weights. Both are population-level regression tools with ±10–15% individual error.
Which should you use? For most healthy adults without body composition data, Mifflin–St Jeor is the better default. Harris–Benedict is valuable for historical comparison, for settings where it is specifically required by a protocol, and for seeing how the two formulas compare for your own body profile.
The most practical approach: run both (use the BMR formula comparison calculator) and look at the spread. If both results cluster within 100–150 kcal/day, use the average. If they diverge by 200+ kcal/day, consider your body composition — high muscle mass tends to push true RMR closer to the higher estimate; high body fat tends to push it lower.
For a deeper side-by-side explanation (including when each formula tends to overshoot), see our BMR formula comparison.
If you know your body fat percentage, skip both and use Katch–McArdle — it works directly from lean body mass and is generally more accurate for people whose body composition differs significantly from the population average.
What are the most common mistakes when using the Harris–Benedict BMR formula?
What are the most common mistakes when using the Harris–Benedict BMR formula?
Harris–Benedict is easy to misapply in ways that quietly undermine your results. Here are the five most common errors and how to avoid them.
Mistake 1 — Using BMR as your calorie intake target.
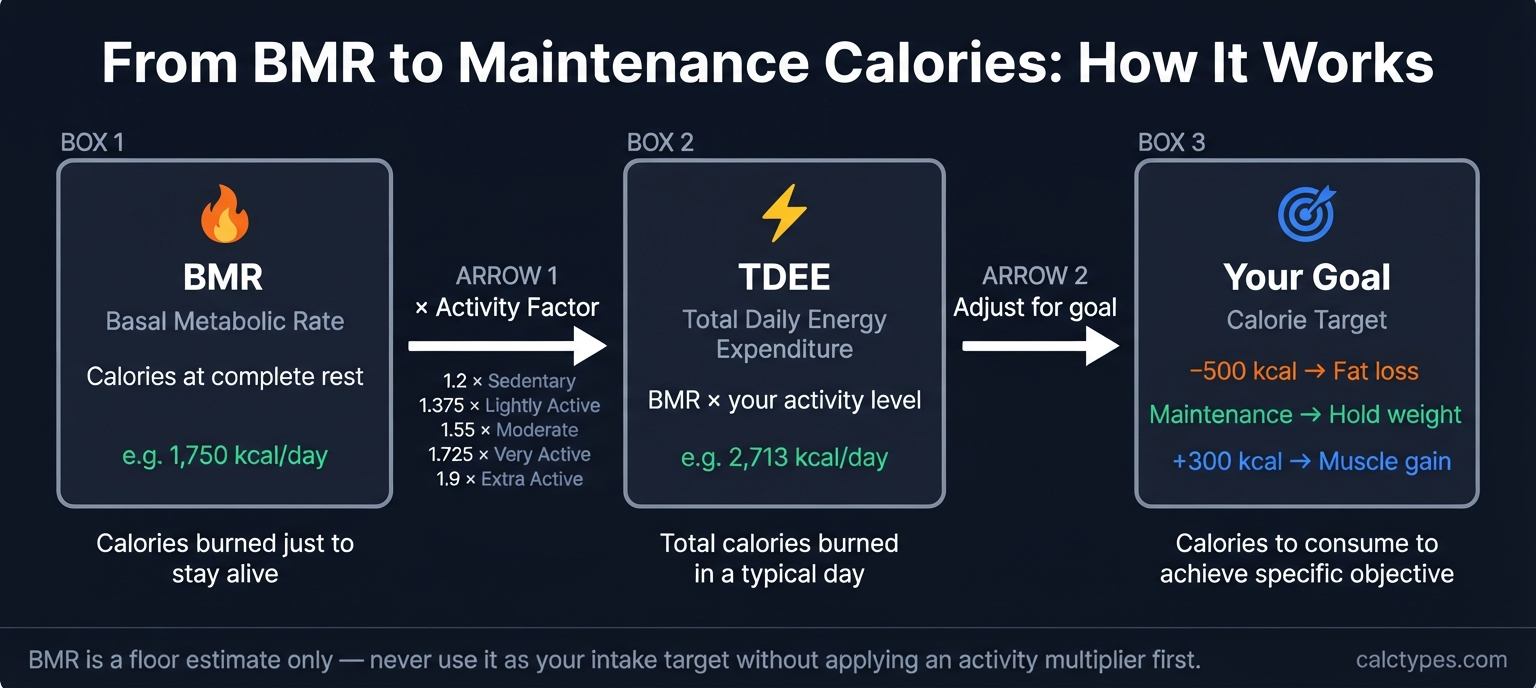
BMR is your resting-only number. Eating exactly at your BMR while living a normal daily life creates a substantial calorie deficit — one that is not appropriate or sustainable for most people outside a supervised medical setting. Your calorie planning should start from maintenance (BMR × activity multiplier), then be adjusted up or down based on your goal.
Mistake 2 — Unit mix-ups.
The Harris–Benedict equation requires weight in kilograms and height in centimetres. Accidentally entering pounds or inches without conversion produces wildly incorrect results. This calculator converts US units automatically. If you ever use the formula manually, always double-check your units before substituting.
Mistake 3 — Expecting clinical precision from a regression equation.
Predictive equations carry a built-in individual error range of roughly ±10–15%. A result of 1,800 kcal/day realistically represents a true RMR somewhere between approximately 1,530 and 2,070 kcal/day for any given individual. Treat the output as a calibrated starting hypothesis — not a personal measurement. Validate it through 2–4 weeks of real-world tracking and adjust accordingly.
Mistake 4 — Ignoring body composition.
Harris–Benedict uses total body weight, not lean mass. Two people with identical height, weight, age, and sex can have meaningfully different actual metabolic rates if their muscle-to-fat ratio differs. Higher muscle mass → higher true RMR than the equation predicts. Higher body fat → lower true RMR. If your body composition is significantly above or below average, consider running Katch–McArdle alongside Harris–Benedict.
Mistake 5 — Skipping the activity multiplier entirely.
Many people read only the raw BMR number and try to plan intake from it directly. BMR does not represent what you actually burn in a day — for most normally active people, TDEE is 30–90% higher than BMR. Always apply an activity factor before using the number for calorie planning. If you are unsure of your activity level, start conservative (×1.375) and refine based on observed weight trends over 2–3 weeks.
What does the Harris–Benedict equation estimate?
What does the Harris–Benedict equation estimate?
The revised Harris–Benedict equation estimates your basal metabolic rate (BMR), which is the energy your body uses at rest to keep basic functions running. It uses easily measured inputs—age, sex, weight, and height—to produce a single “kcal/day” estimate. That simplicity is exactly why it’s popular, and also why it has limits: it can’t fully reflect individual differences in body composition, health status, or genetics.
A helpful way to use it is as a baseline. If your goal is maintenance planning, you usually need an activity-adjusted estimate (often called TDEE). If your goal is weight change, the safer approach is to start with an estimate, monitor outcomes for a few weeks, then adjust gradually. If your result looks wildly high/low, the most common causes are unit errors (lb vs kg, ft/in vs cm) or unrealistic activity assumptions.
Why does my BMR look too high or too low?
Why does my BMR look too high or too low?
The most common reason is a unit mismatch (for example, entering pounds while thinking the tool expects kilograms, or mixing feet/inches and centimeters). The second most common reason is expectation: people sometimes expect BMR to equal “maintenance.” BMR is resting needs; maintenance typically requires multiplying by an activity factor (and even that’s still an estimate).
Also, predictive equations don’t capture everything. People with unusually high muscle mass, certain health conditions, or medication effects may find the estimate off. If your result doesn’t match your lived experience, use it as a starting hypothesis and adjust based on consistent weekly trends—rather than trying to “force” your body to match the number.
How do I convert BMR to maintenance calories?
How do I convert BMR to maintenance calories?
A common approach is: TDEE ≈ BMR × activity multiplier. The multiplier is meant to approximate the combined effect of daily movement, exercise, and lifestyle. That’s why the calculator offers an activity selector: it gives you a quick maintenance estimate without requiring advanced tracking.
Treat that maintenance number as an initial target band, not a strict rule. If you consistently gain weight at the “maintenance” estimate, it likely overshoots your real needs. If you consistently lose weight, it likely undershoots. Real maintenance is best estimated by observing what happens over time—especially if your routine is stable. For deeper planning, open the TDEE calculator and use it alongside weight trend monitoring.
Is BMR the same as resting metabolic rate (RMR)?
Is BMR the same as resting metabolic rate (RMR)?
In casual usage, people often use BMR and RMR interchangeably. Technically, BMR is measured under stricter resting conditions, while RMR may be measured under slightly less strict conditions. Most online calculators—including Harris–Benedict—are closer to “resting energy estimate” tools than true lab BMR.
Practically, the difference matters less than consistency: use the estimate to build a plan, then calibrate it with real outcomes. If you’re using a wearable or lab measurement, consider it additional context rather than a replacement for trend-based adjustments.
Want the strict definitions and real-world examples? See BMR vs RMR.
Can I use this calculator if I’m under 18 or pregnant?
Can I use this calculator if I’m under 18 or pregnant?
This calculator is primarily designed for adults and general education. Teens are still growing, and pregnancy/lactation changes energy needs substantially. Using a generic adult equation as a strict target can be misleading and sometimes harmful—especially if it leads to restrictive intake.
If you’re under 18, pregnant, or managing a medical condition, it’s safer to use clinician-guided recommendations. You can still use the tool as an educational estimate, but avoid making aggressive dietary changes based only on a single number.
What’s the most common mistake people make with BMR calculators?
What’s the most common mistake people make with BMR calculators?
The biggest mistake is using BMR as an intake target without considering activity. For most people, eating at BMR would be below maintenance and may be overly aggressive depending on context. The second mistake is chasing day-to-day precision: energy needs fluctuate, and predictive equations are approximate.
A better workflow is: estimate → pick a conservative plan → monitor weekly trend → adjust gradually. This keeps the tool useful without turning it into a false “precision” device.
Should I pick Harris–Benedict or Katch–McArdle?
Should I pick Harris–Benedict or Katch–McArdle?
Katch–McArdle uses lean body mass (LBM), which can be useful if you have a reasonably accurate body fat % estimate. But if body fat % is estimated poorly (common with consumer BIA), the LBM input can add noise rather than accuracy.
Harris–Benedict is simpler (height/weight/age/sex), which can make it more stable when you don’t trust body fat %. If you have a consistent body fat % method, you can explore Katch–McArdle using our Katch–McArdle calculator.
Is it safe to eat below your BMR to lose weight?
Is it safe to eat below your BMR to lose weight?
Eating below your BMR is not automatically “unsafe,” but it’s often misunderstood. BMR is the energy your body would use at rest; it is not a recommended intake target. If you eat below BMR while also living a normal life (walking, working, training), you are usually creating a relatively large deficit—sometimes larger than intended. For some people this may be tolerable short-term; for others it can increase fatigue, hunger, irritability, training decline, or binge/restrict cycles.
A safer planning approach is to start from an estimated maintenance (activity-adjusted) number, then reduce gradually and validate with weekly trends. If your goal is fat loss, the “best” deficit is the one you can sustain while maintaining health markers (sleep, recovery, mood, performance) and getting predictable results. If you have a history of disordered eating, are under 18, pregnant/lactating, or have medical conditions, avoid using BMR as a restriction target and seek professional guidance.
Does lifting weights or gaining muscle increase BMR?
Does lifting weights or gaining muscle increase BMR?
Increasing lean mass can raise resting energy needs, but the effect is usually gradual—not magical. Muscle is metabolically active tissue, so more lean mass tends to correlate with higher resting expenditure. That said, people often overestimate how big the “muscle = more calories burned” effect is on its own. In many real transformations, the larger driver of higher maintenance is the combination of more lean mass plus higher activity (training volume, steps, general movement) and often a larger body overall.
The most practical implication is this: if you lift consistently, your maintenance calories may drift upward over time, and a fixed calorie target can stop working. Re-check your trend every few weeks. If weight is creeping up unintentionally, your maintenance estimate is likely too high; if you’re losing unintentionally, it may be too low. This is also why “activity-adjusted” maintenance (TDEE) is typically the better day-to-day planning target than BMR alone.
Which activity multiplier should I use for maintenance calories (TDEE)?
Which activity multiplier should I use for maintenance calories (TDEE)?
Activity multipliers are shortcuts, not truth. They try to summarize your total daily movement (work, steps, training, household activity) into one factor. The common mistake is picking the multiplier based on identity (“I train hard”) rather than on total weekly movement (“How many steps, how many sessions, what kind of job?”). If you choose too high, the calculator will overestimate maintenance; too low, and it will underestimate.
A realistic way to choose is to start slightly conservative (for many people, sedentary-to-moderate is more accurate than “very active”), then validate using 2–4 weeks of data. If your weekly average weight is stable at the suggested maintenance intake, the multiplier was close. If you gain steadily, reduce intake or multiplier; if you lose steadily, increase. This turns the multiplier from a guess into a calibrated setting that matches your real life.
Sources
Disclaimer
This calculator is for educational purposes only and is not medical advice. It provides a predictive estimate, not a laboratory measurement.
Do not use this tool for diagnosis, treatment decisions, or medical clearance. If you’re under 18, pregnant/lactating, or managing a health condition, consult a qualified professional. Read the full disclaimer.