Body Fat Percentage Guide: What It Is, How to Measure It, and How to Use It
Body Fat Percentage: What It Is, How to Estimate It, and How to Use It
A practical guide to understanding body fat percentage — common measurement methods, typical sources of error, and how body fat % affects LBM-based calorie estimates like Katch–McArdle.
What body fat percentage means
Definition
Body fat percentage (BF%) is the proportion of your total body weight made up of fat mass. Everything else is lean body mass (LBM), which includes muscle, bone, organs, connective tissue, and body water. BF% is a body composition estimate — not a diagnosis.
How to use it in real life
BF% is most useful as a trend metric: if you measure consistently, a long-term decrease can indicate fat loss even if scale weight is stable (for example, during recomposition when lean mass rises). Conversely, day-to-day noise — especially from BIA scales — is normal and should not be over-interpreted.
How body fat % is measured (common methods)
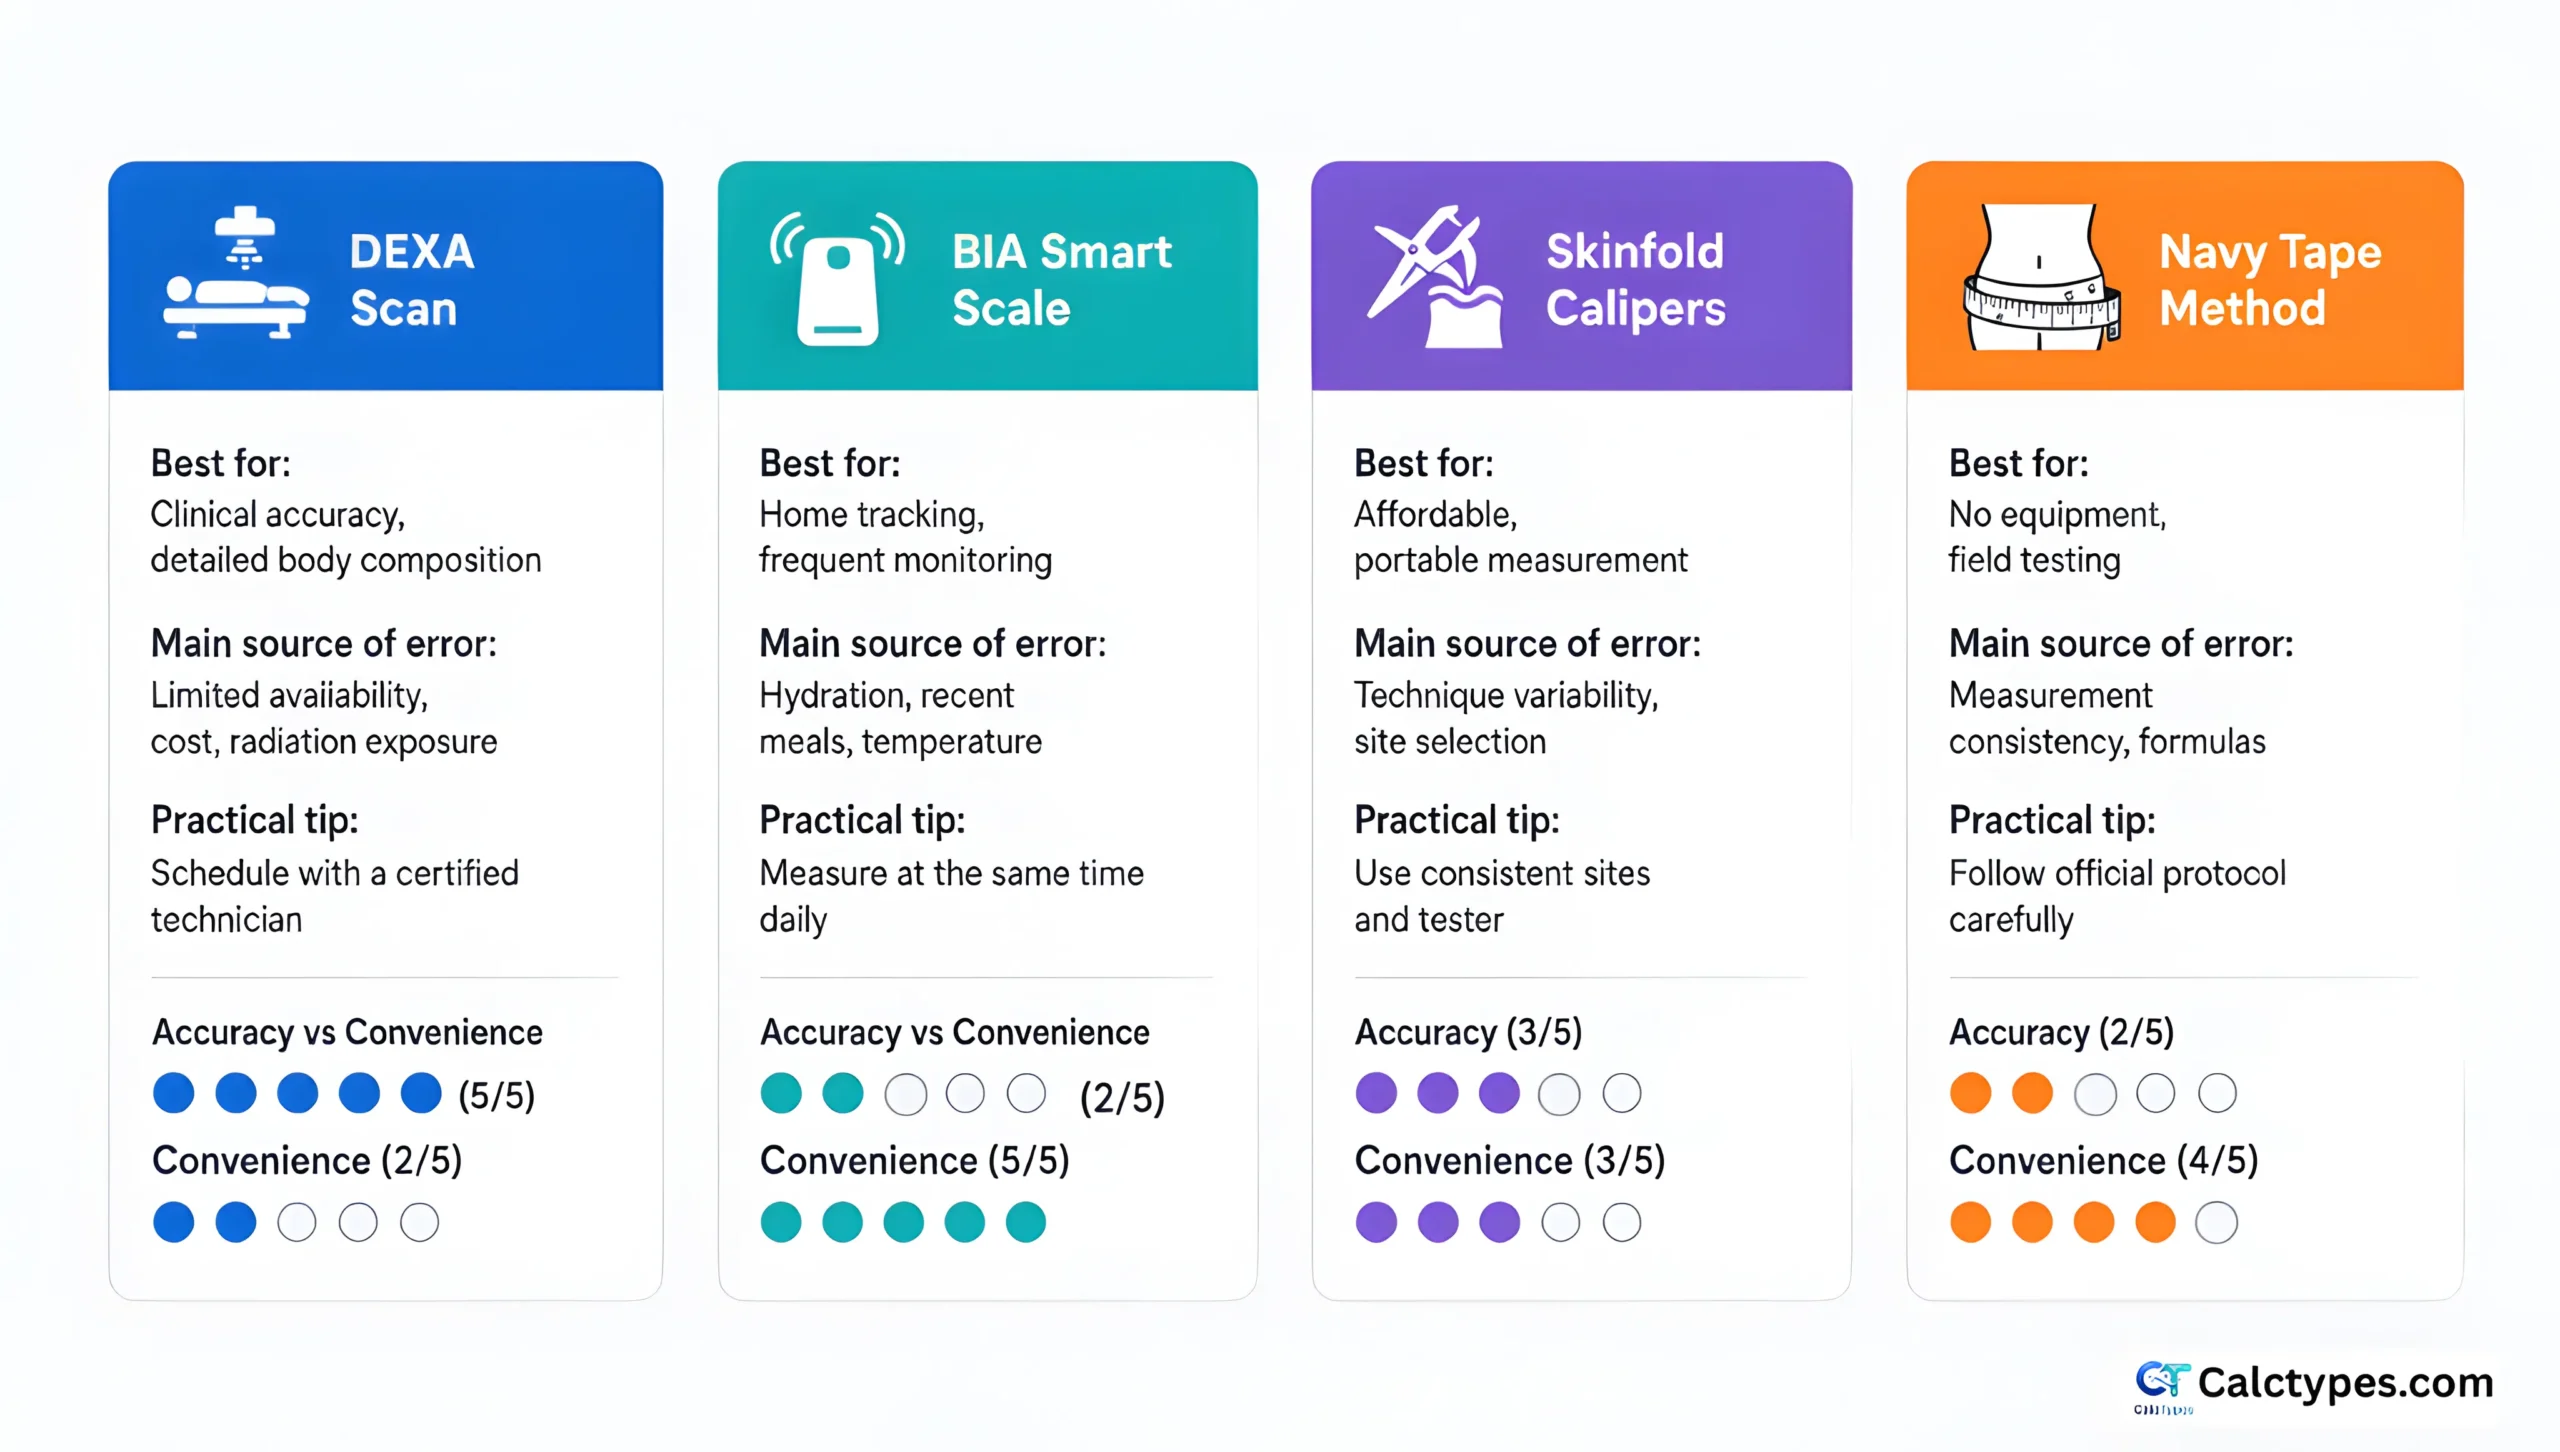
DEXA scan
Often one of the higher-confidence consumer-accessible methods. Still varies by device, protocol, and hydration; best for periodic benchmarking.
Skinfold calipers
Useful for trend tracking when performed consistently by a trained person using the same sites and equation. Error mainly comes from technique and tester variation.
BIA (bioelectrical impedance) scales
Convenient but sensitive to hydration, food intake, exercise timing, temperature, and device algorithm differences. Best used for trends under standardized conditions.
Circumference-based methods (e.g., Navy method)
Uses tape measurements and equations. Low cost and accessible, but not a direct measurement; technique consistency matters.
Why body fat % estimates vary
Common error sources
- Hydration and food intake: especially affects BIA.
- Technique: calipers and tape methods depend on repeatable site location and tension.
- Device differences: algorithms differ; readings can disagree across brands.
- Timing: exercise, sleep, travel, sauna, or stress can change readings.
Body fat % reference ranges (by sex)
Reference ranges are descriptive population categories, not individual medical targets. Age, training status, and health context matter.
| Category | Males (approx.) | Females (approx.) |
|---|---|---|
| Essential fat | 2–5% | 10–13% |
| Athletic | 6–13% | 14–20% |
| Fitness | 14–17% | 21–24% |
| Average | 18–24% | 25–31% |
| Above average | 25%+ | 32%+ |
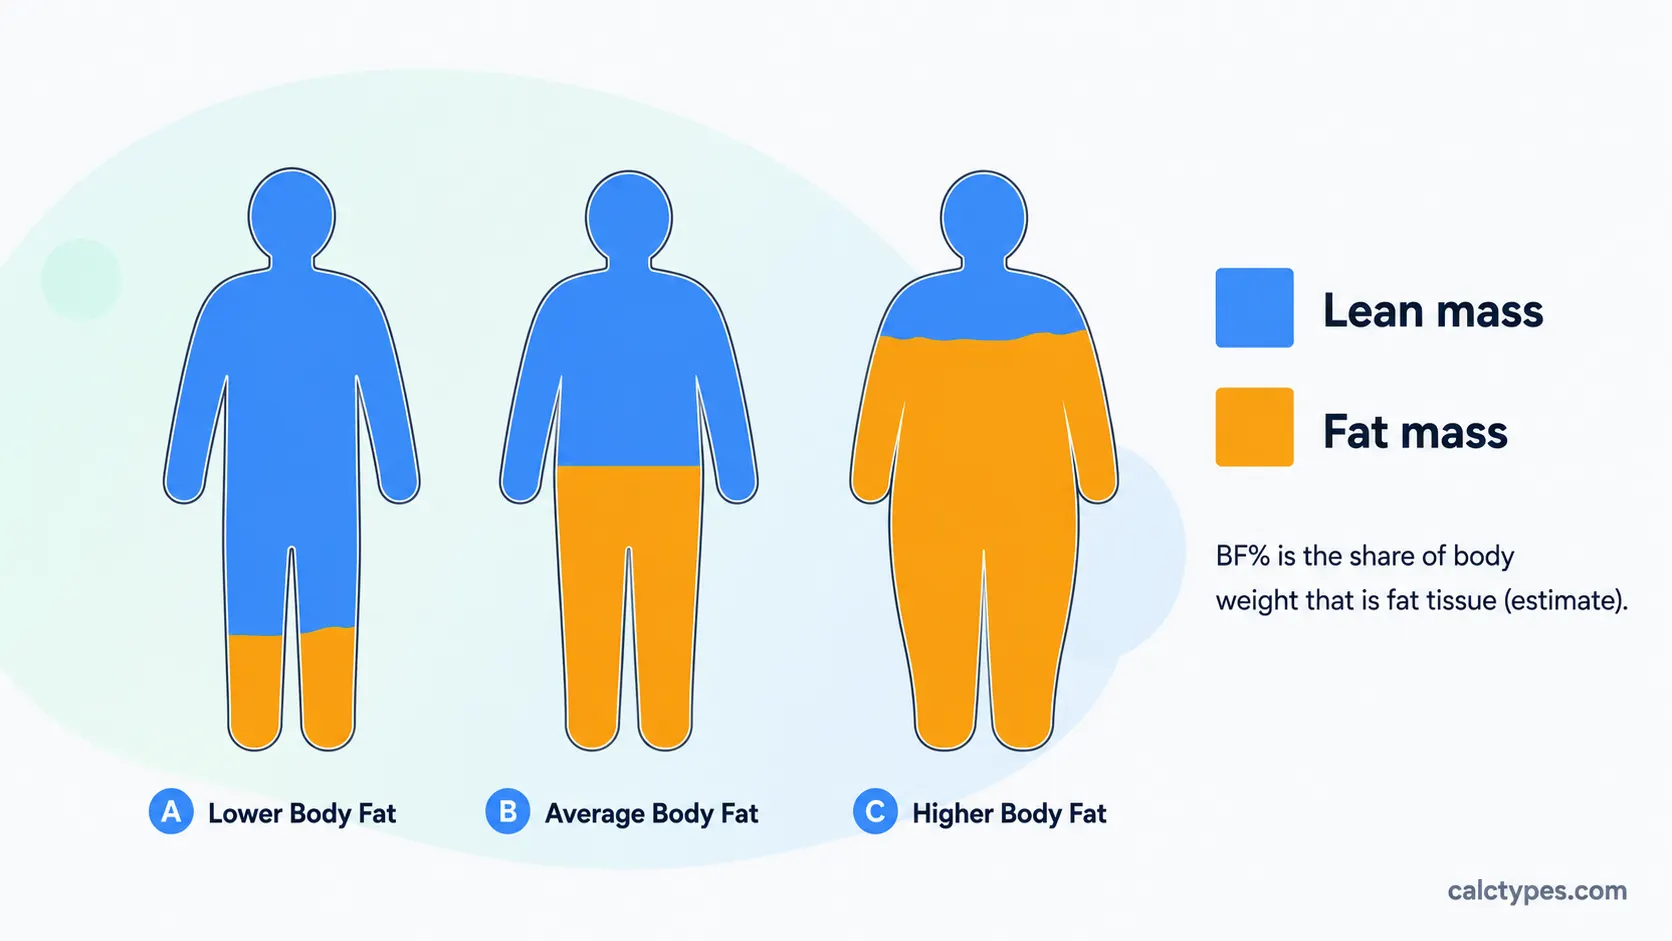
Body fat % → lean body mass (LBM)
Formula
Lean body mass can be estimated from weight and BF%: LBM = weight × (1 − bodyFat%/100).
Try it here: Lean Body Mass Calculator.
Why body fat % matters for Katch–McArdle
Katch–McArdle estimates BMR using lean body mass. If your BF% estimate is off, your LBM estimate is off — and your BMR estimate shifts. That doesn’t make the method “wrong”; it means you should treat the result as a planning estimate and calibrate using trends.
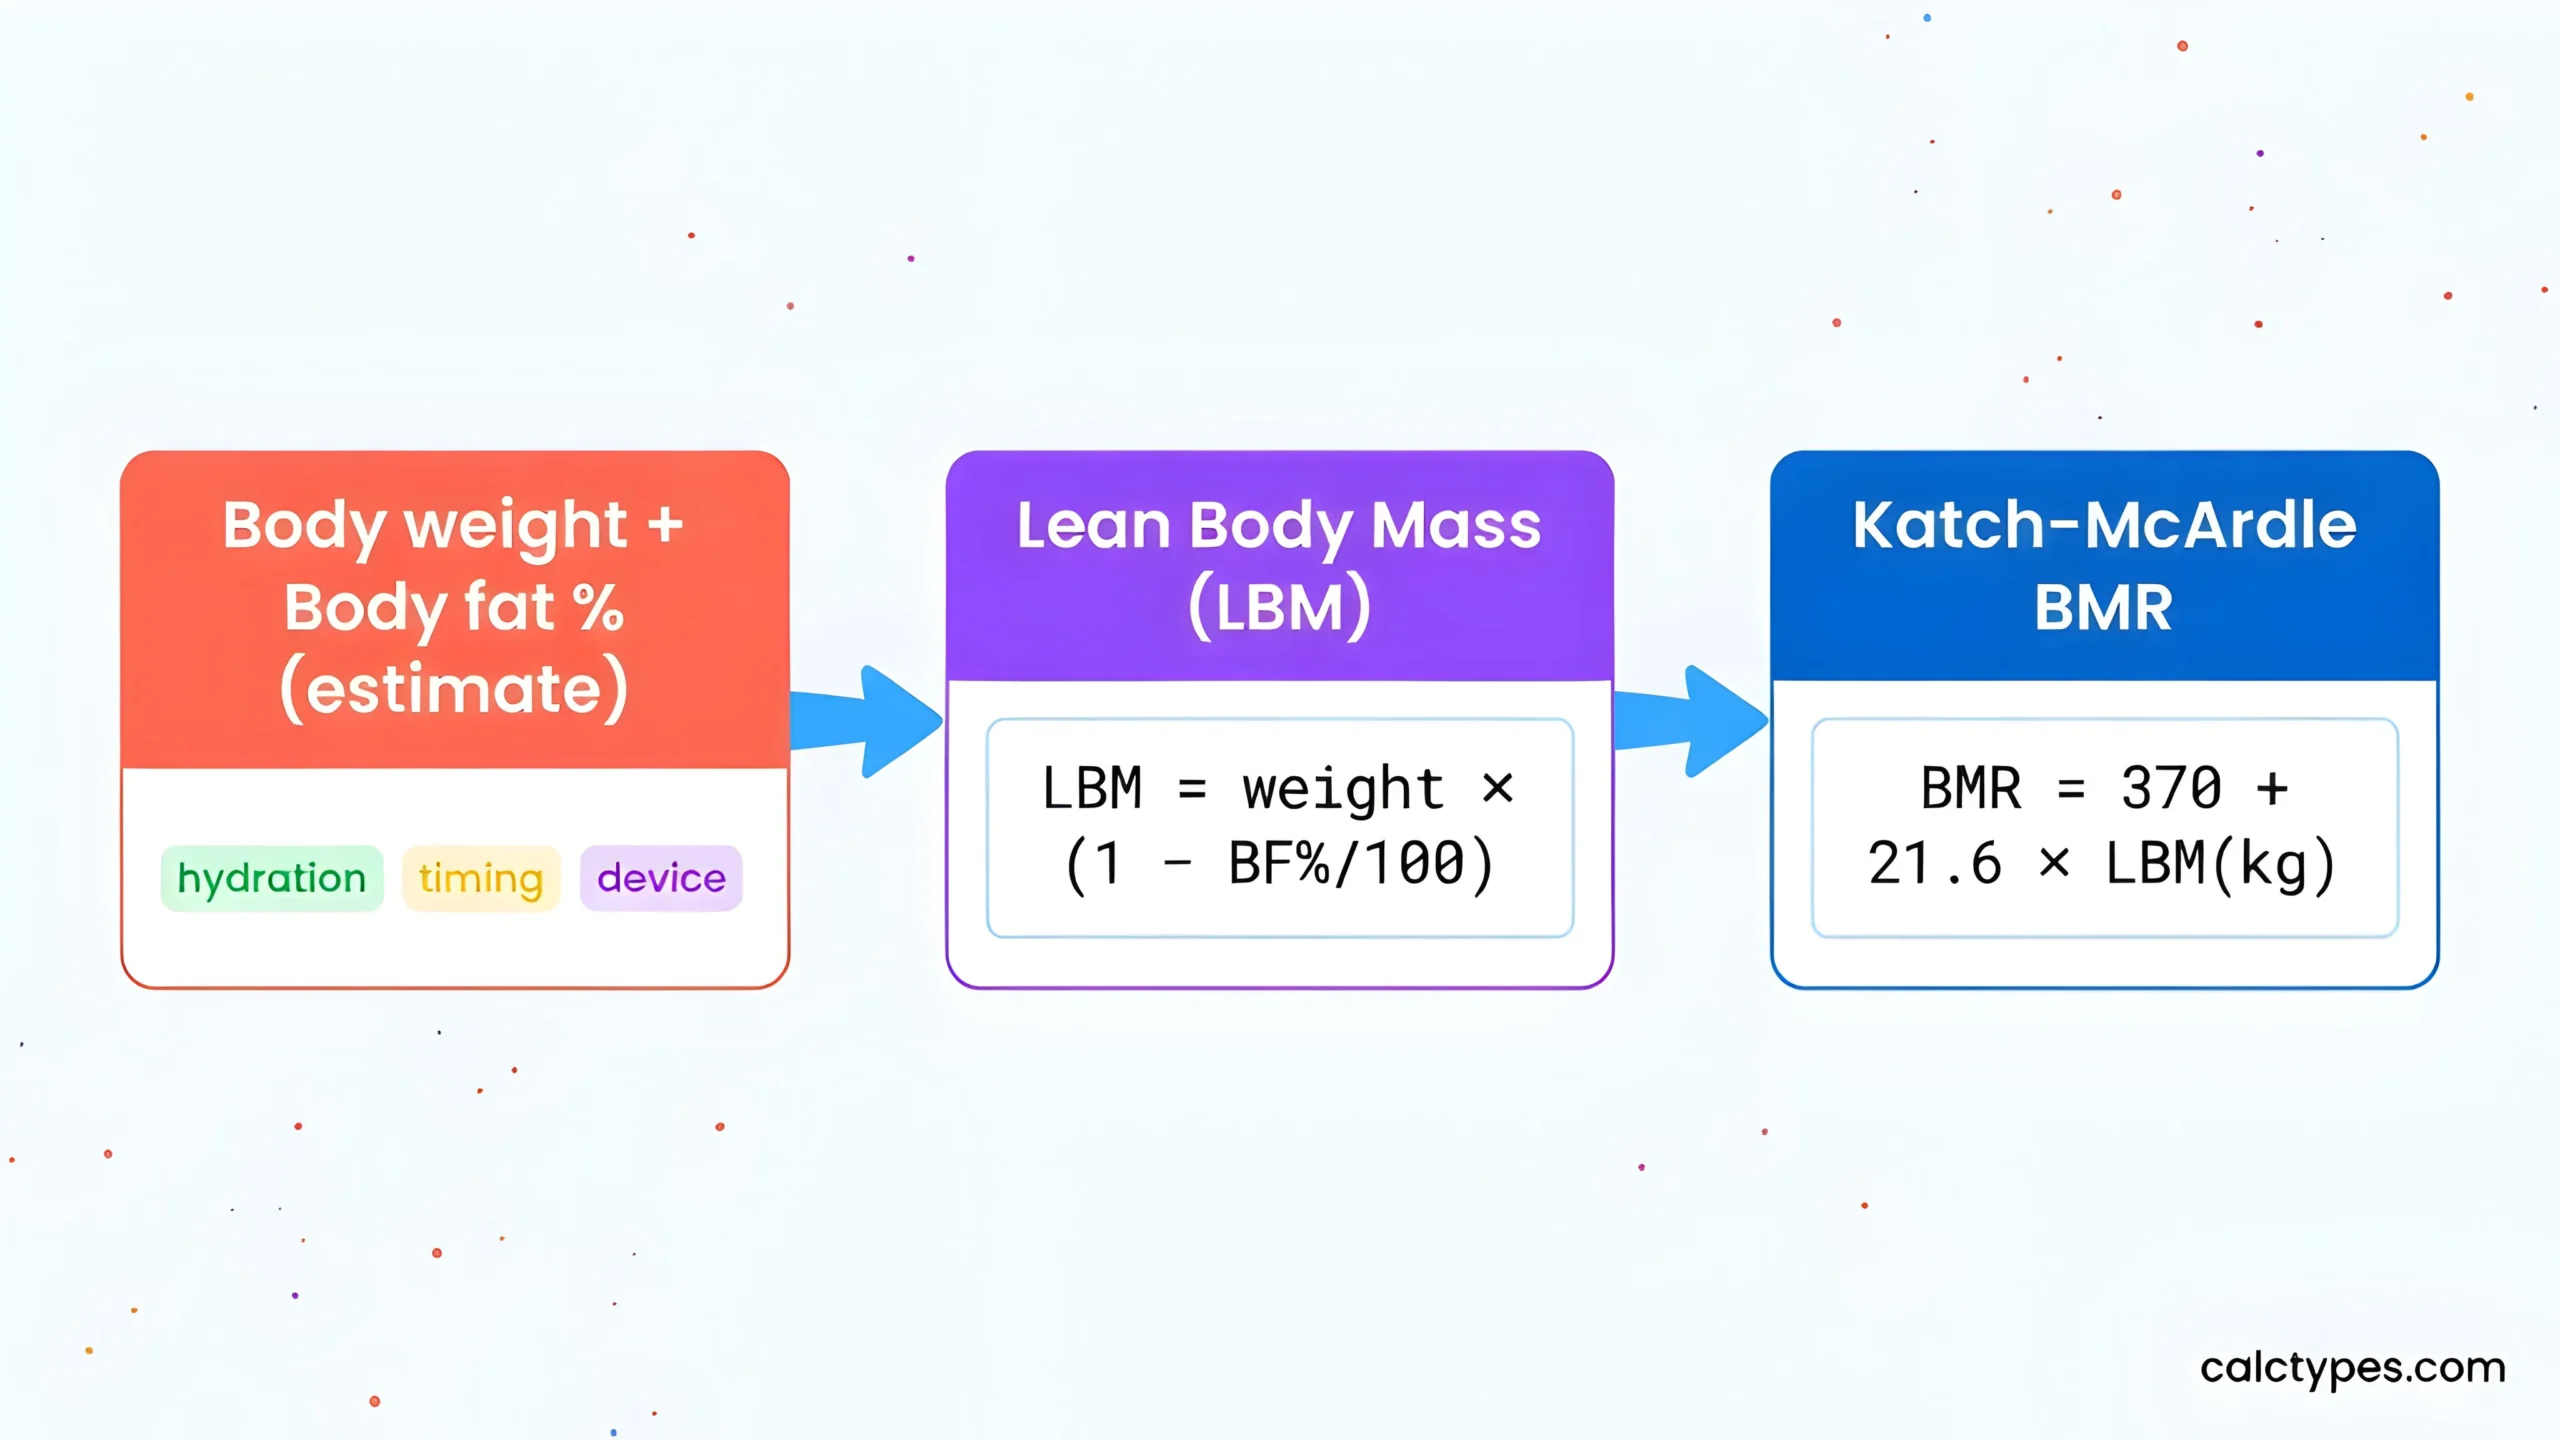
Use: Katch–McArdle BMR Calculator and compare with Mifflin–St Jeor (or the BMR Calculator).
How to track body fat % responsibly (practical tips)
Best practices
- Use the same method and consistent conditions (time of day, hydration, meals).
- Track trends over weeks, not single readings.
- Pair with waist measurements (if appropriate), photos, performance, and wellbeing.
- For calorie planning, use the TDEE Calculator and adjust based on outcomes.
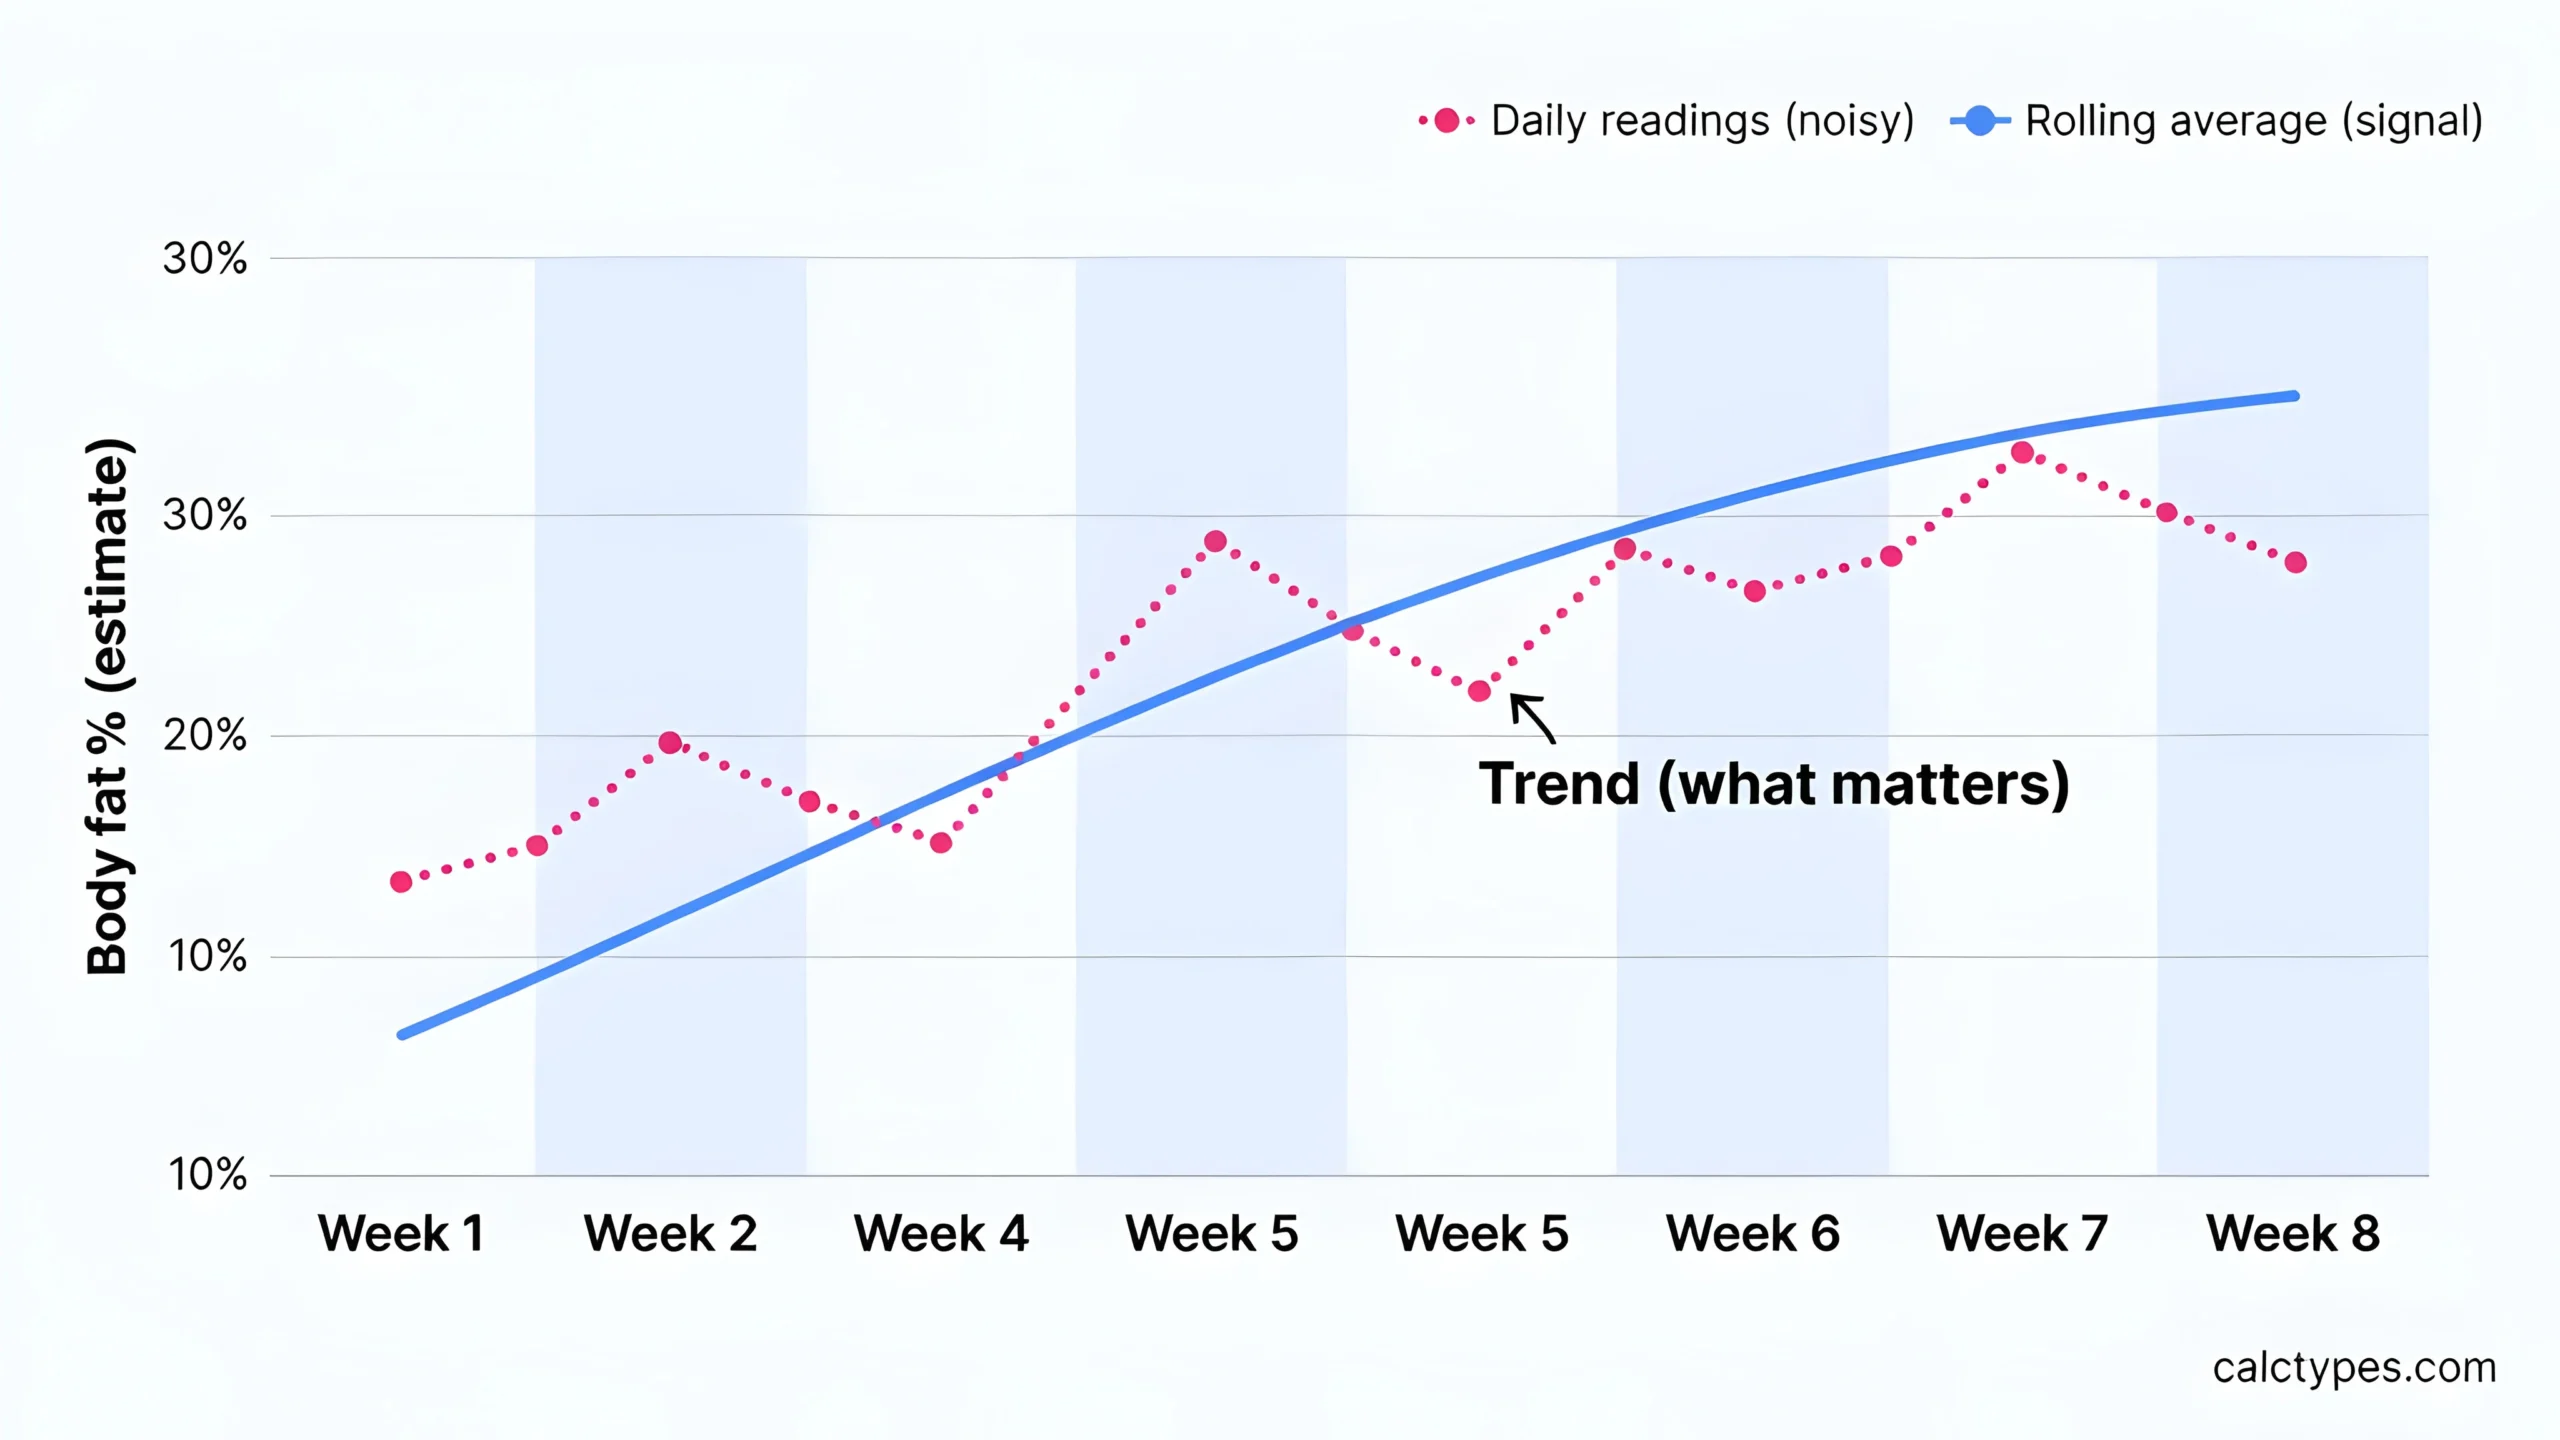
Questions people ask
What is a “healthy” body fat percentage?
There isn’t a single universally “healthy” number that fits everyone. BF% exists in context: age, biological sex, training status, and health history all change how a number should be interpreted. Many reference ranges (including popular “athletic/fitness/average” charts) are descriptive categories based on population data, not diagnostic cutoffs. A number that’s appropriate for a competitive athlete may be unrealistic or harmful for a non-athlete, and very low BF% can carry meaningful risks.
A practical way to use “healthy” is to look for a range that supports your overall wellbeing: stable energy, good recovery, normal sleep, and sustainable eating habits—while your longer-term trend is moving the direction you want. For example, someone may aim to reduce BF% gradually while maintaining strength and mental wellbeing, rather than chasing a category label.
If you’re unsure how to interpret BF%—especially with medical conditions or a history of disordered eating—treat BF% as a secondary metric and consult a qualified clinician or dietitian for individualized guidance.
Why do different methods give different body fat % results?
Different methods are not measuring the same thing in the same way. DEXA estimates tissue composition using X-ray attenuation, BIA estimates body water and converts it to lean mass using device-specific equations, calipers estimate subcutaneous fat thickness, and tape methods infer BF% from circumference patterns. Each step involves assumptions—about hydration, fat distribution, or population averages— so methods naturally disagree.
Example: your smart scale (BIA) can swing several percentage points depending on hydration and recent exercise, while a DEXA scan may remain relatively stable. That doesn’t necessarily mean you gained or lost fat overnight; it often means the measurement conditions changed. For tracking, pick one method and standardize your routine rather than comparing numbers across devices.
If you want to compare methods at all, do it once to understand the bias (e.g., “my BIA reads ~3% higher than DEXA”), then track trends with one method afterward.
Can I use a smart scale body fat % for Katch–McArdle?
Yes—if you treat it as a consistent estimate, not a precise measurement. Katch–McArdle requires lean body mass, and LBM depends directly on the BF% you enter. Smart scales can be useful because they’re easy to repeat frequently, but they’re also sensitive to hydration and timing. That sensitivity can create the illusion of rapid fat changes, which then pushes your LBM and BMR estimates around unnecessarily.
A better approach is to standardize conditions (morning, after restroom, before food/drink, similar hydration) and use weekly averages. Then plug that BF% into your Katch–McArdle BMR Calculator, and compare results against other formulas on the BMR Calculator.
The most important step is calibration: run your chosen calorie target for 2–4 weeks, track outcomes, and adjust calories in small increments. That will outperform any attempt to get “perfect” smart-scale BF% accuracy.
What if my body fat % estimate feels unrealistic?
First, assume the reading may be affected by conditions rather than being “wrong.” BIA is particularly sensitive: dehydration, a salty meal, alcohol, heat exposure, late-night measurements, and recent training can all change impedance and shift the estimated BF%. Retest under standardized conditions before drawing conclusions.
Second, cross-check with another signal: waist measurements, progress photos, strength trend, and scale-weight trend over several weeks. If those signals suggest fat loss but BF% is “stuck,” your BF% method may be too noisy to detect short-term change.
Third, if you need a clearer baseline, consider a higher-confidence benchmark like a professionally performed caliper test or a DEXA scan. The goal isn’t a perfect number forever; it’s a reasonable baseline and consistent trend tracking.
Sources
Methodology
This page is an educational guide summarizing commonly used BF% measurement approaches, typical error sources, and how BF% is used to estimate LBM for calorie-planning formulas such as Katch–McArdle. Reference ranges and definitions are drawn from the sources listed above.
No original clinical claims are made. Where formulas are shown (e.g., LBM from BF%), they are standard relationships and are included to support understanding.
Limitations & disclaimer
- BF% is an estimate; accuracy depends heavily on method and conditions.
- Numbers from different methods/devices are not directly comparable.
- BMR/TDEE outputs are planning estimates; calibrate with real outcomes.