Sugar per 100g vs Per Serving: Which Number Should You Use?
Two Numbers, One Label: What Each Sugar Figure Actually Means
Every food label shows at least two sugar figures: one per 100g and one per serving. Most people read only one of them — and pick the wrong one for the task they have in mind. This guide explains exactly what each number is for, when to use which, and how to avoid the label tricks that make sugary foods look healthier than they are. If you want to compare the difference between added sugar and total sugar, that distinction matters here too.
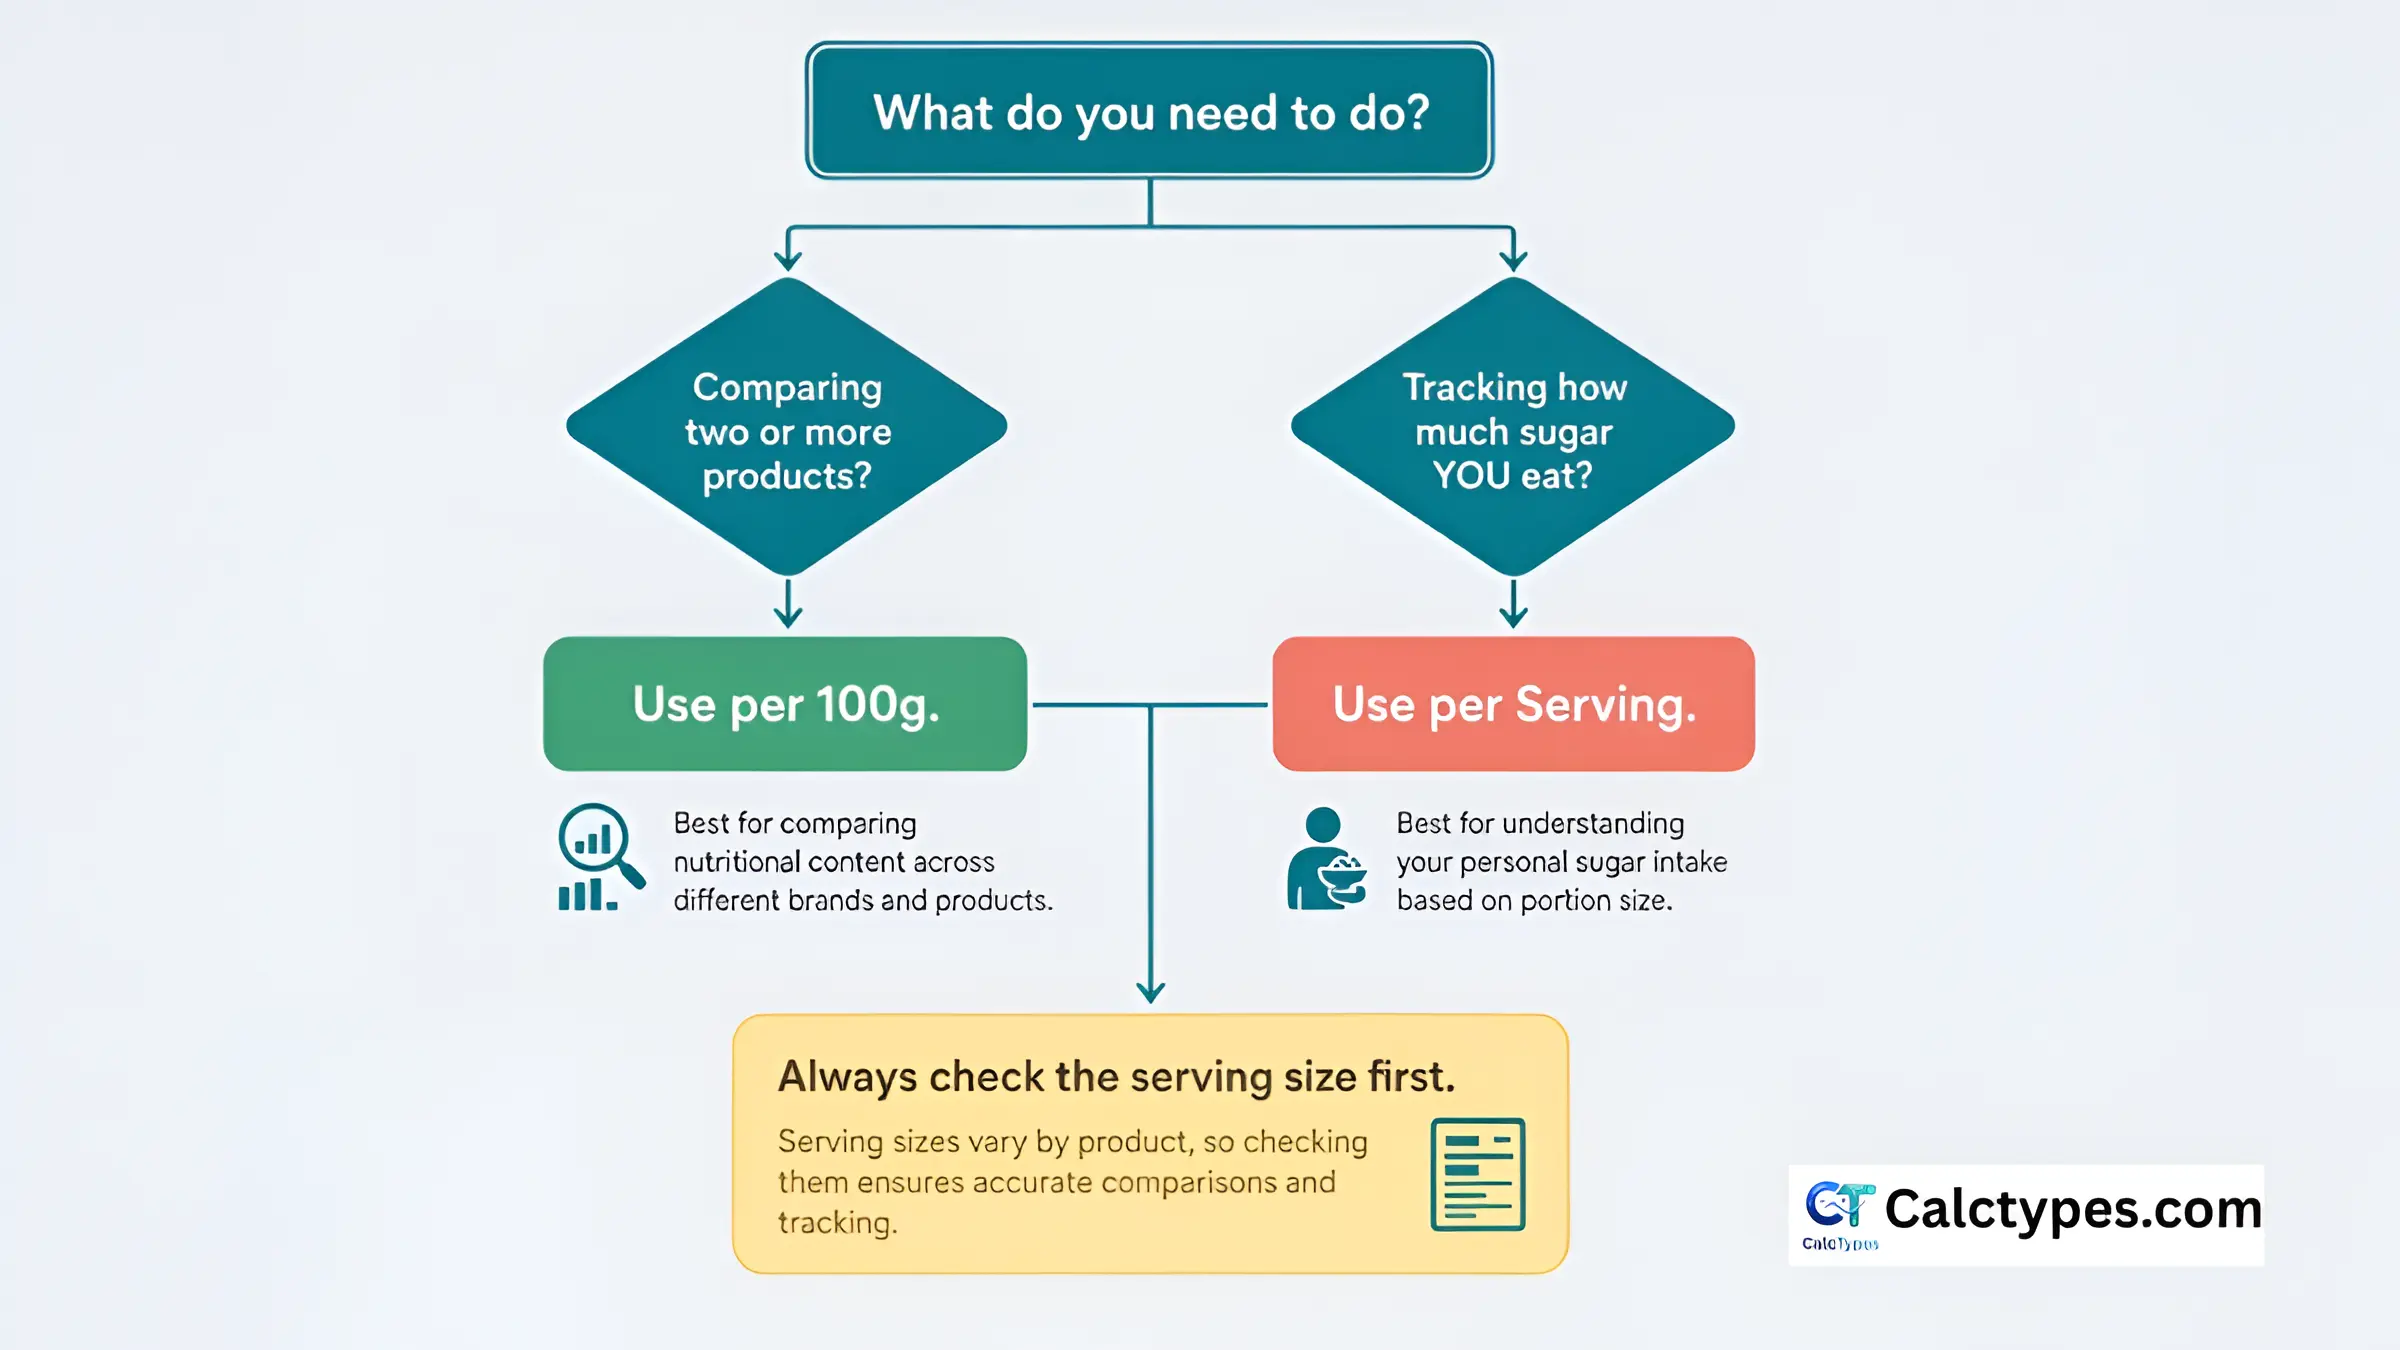
Comparing two products? Use the per-100g column — it puts every product on equal footing regardless of pack or portion size.
Tracking what you actually eat? Use the per-serving figure — but always verify that the declared serving matches how much you really consume.
Content review
On this page
- What each sugar figure means
- When to use per 100g vs per serving
- Decision flowchart
- How serving sizes are set — and why they vary
- Label tricks: how serving sizes mislead
- Total sugar vs added sugar on the label
- Daily sugar limits and putting the numbers in context
- Step-by-step: comparing two products using per 100g
- Calculating sugar for your actual portion size
- Understanding %DV (percent daily value)
- Sugar benchmarks: what’s low, medium, high per 100g?
- Special contexts: children, diabetes, weight loss
- Label terms decoded
- Questions people ask
- Disclaimer
- Related calculators
- Methodology
- Sources
What Each Sugar Figure Means
Open any packaged food and the nutrition panel will present sugars in at least two ways. In the UK, Europe, and Australia these are mandatory columns. In the US, the Nutrition Facts panel shows per-serving values by default (with per-100g rarely shown except on some imports). Understanding the logic behind each column is the first step to reading labels correctly.
📊 Per 100g (or per 100ml)
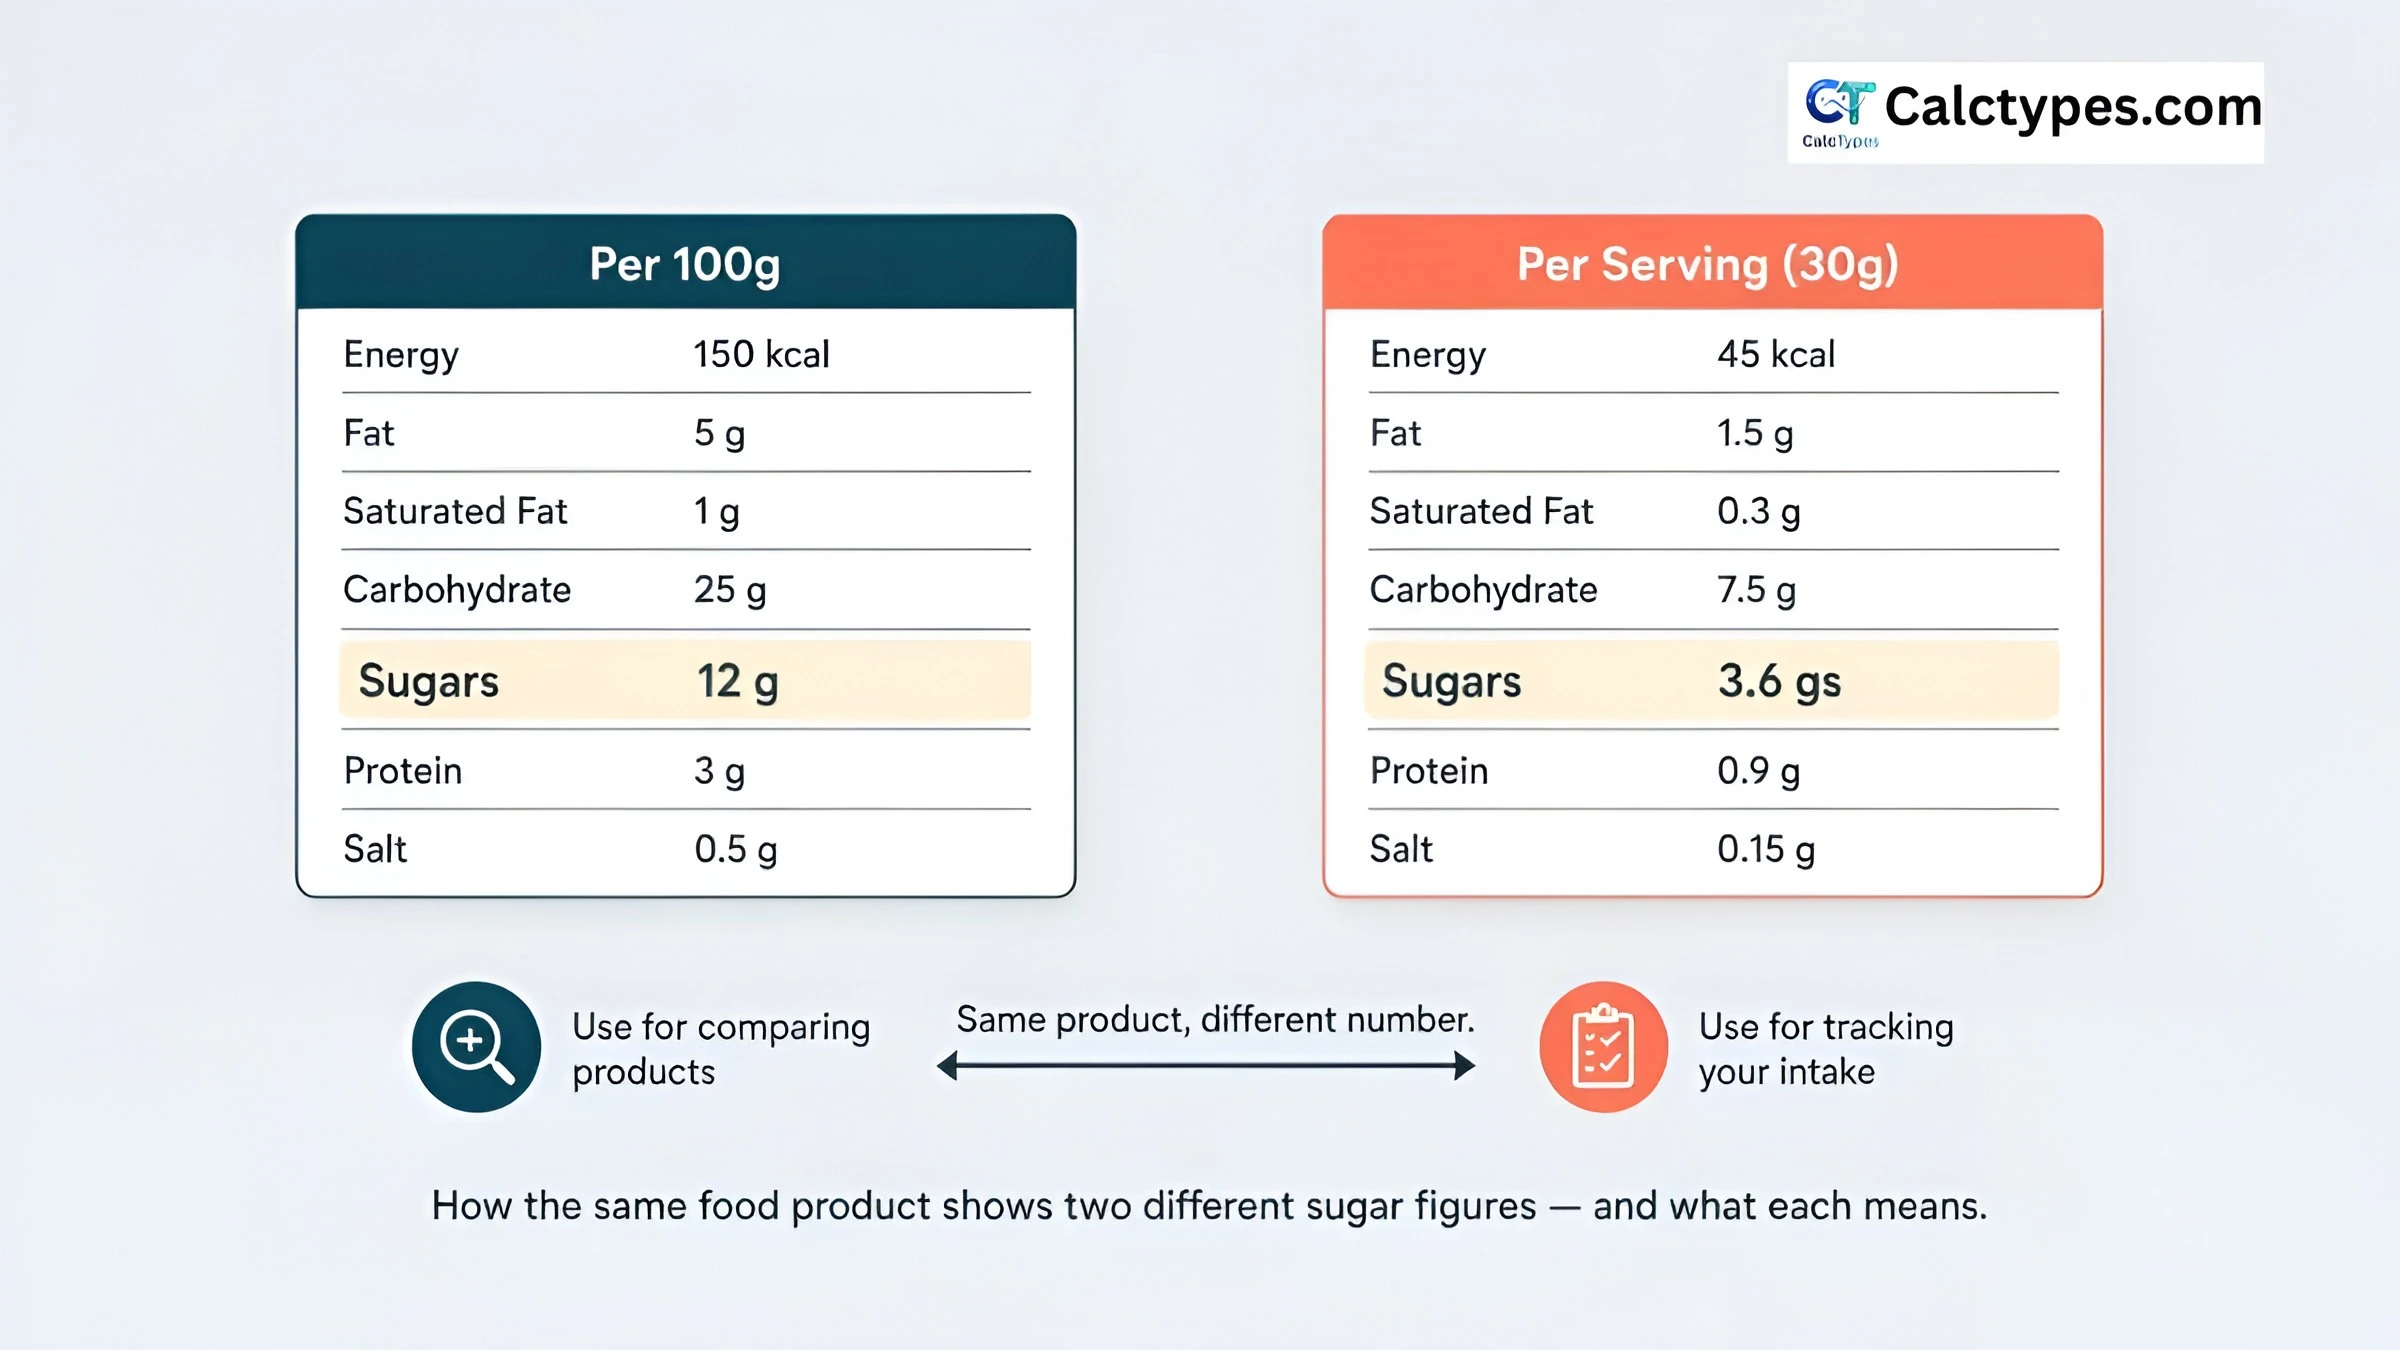
This is a standardised, proportional figure. It tells you how much sugar exists in every 100 grams of the product regardless of how it is packaged or portioned. Because the base is always the same — 100g — you can place any two products side by side and compare them directly.
Think of it as the product’s sugar concentration. A product with 18g sugar per 100g is more sugar-dense than one with 8g per 100g, full stop — regardless of pack sizes.
Best used for: Comparing similar products in the supermarket.
🍽️ Per serving
This figure tells you how much sugar is in one declared serving of the product. The serving size is set by the manufacturer (in the US, the FDA provides reference amounts, but manufacturers still have some discretion on how they interpret them).
A serving might be 30g, 45g, 200ml, or “one biscuit.” The per-serving number tells you what you’d consume if you ate exactly that amount — which may or may not match what you actually put on your plate.
Best used for: Estimating your personal sugar intake from a realistic portion.
When to Use Per 100g vs Per Serving
The confusion between these two figures is not just academic — it affects real purchasing decisions and health outcomes. Here is a clear decision guide.
Use per 100g when you are comparing products
Imagine you are choosing between two breakfast cereals: Brand A has 22g sugar per 100g and Brand B has 12g sugar per 100g. Brand A’s serving is 30g (6.6g sugar per serving) and Brand B’s serving is 45g (5.4g sugar per serving). The per-serving figures suggest Brand B is only marginally lower in sugar — but the per-100g figures reveal Brand A is nearly twice as sugar-dense. If you ever pour more than 30g (which most people do with cereal), Brand A will deliver significantly more sugar.
Per 100g is the only fair comparison metric because it removes the influence of serving size definitions. You can use our compare sugar in two products calculator to do this instantly with any two foods.
- Comparing different brands of the same food type
- Comparing different flavours within a brand
- Checking whether a “reduced sugar” version actually contains less sugar
- Building a mental map of which food categories are inherently high in sugar
Use per serving when you are tracking your own intake
If your goal is to manage how much sugar you consume in a day — whether for blood glucose management, weight loss, or simply meeting a dietary goal — you need to know the dose, not the concentration. Per 100g tells you nothing useful here unless you happen to eat exactly 100g.
For example, a teaspoon of honey has roughly 85g sugar per 100g — which sounds alarming. But a single teaspoon of honey weighs about 7g, meaning you’re actually consuming around 6g of sugar — less than one and a half teaspoons of table sugar. Per 100g made honey look like a sugar bomb; per serving puts it in a realistic context.
- Logging food in a nutrition app
- Counting grams of sugar against a daily target
- Managing conditions that require sugar monitoring (e.g., type 2 diabetes)
- Checking whether a snack “fits” within a calorie or sugar budget
Important caveat: Always verify that the declared serving size reflects what you actually eat. If the serving says 30g but you eat 60g, double the per-serving figure.
Use both when you really need the full picture
The most nutritionally literate approach is to use both figures together. Check per 100g to understand the product’s inherent sugar density, then use per serving (adjusted for your actual portion) to calculate your real intake. This two-step check helps you avoid both of the most common labelling traps: overly favourable serving-based impressions and misleadingly alarming per-100g figures for foods eaten in very small quantities.
Decision Flowchart: Which Number Should You Use?
The chart below summarises the decision logic in a quick visual format. Save it for reference next time you are standing in a supermarket aisle.
How Serving Sizes Are Set — and Why They Vary
One of the most common sources of labelling confusion is that serving sizes are not standardised in the same way that the per-100g figure is. This means the per-serving column can shift dramatically between brands and countries.
US: FDA reference amounts (RACC)
In the United States, the FDA defines “Reference Amounts Customarily Consumed” (RACC) — a category-by-category framework of what a typical person eats in a single sitting. The 2016 FDA Nutrition Facts label update revised many of these amounts to better reflect actual consumption patterns.
Crucially, US labels show the per-serving figure prominently and do not typically include a per-100g column, making direct international product comparison harder for American consumers. Our added sugar label calculator can help you extract and compare meaningful figures from US-format labels.
UK/EU: mandatory dual column
Under EU Regulation 1169/2011 (retained in UK law post-Brexit), most packaged foods must include nutritional information per 100g or per 100ml. A per-portion column is optional but encouraged, and many UK manufacturers include both. The UK’s traffic light labelling system — which uses colours (green/amber/red) based on whether a nutrient is low, medium, or high — typically applies to the per-portion figure, adding another layer to interpretation.
Australia and New Zealand
Food Standards Australia New Zealand (FSANZ) requires both per-serving and per-100g (or per-100ml) information. The per-serving column uses the manufacturer’s declared serving, which can vary considerably. Consumers are encouraged to use the per-100g column for comparison, a message that health authorities have been trying to mainstream for years.
Label Tricks: How Serving Sizes Can Mislead
Food manufacturers are sophisticated communicators. The serving size declaration is one of the most powerful levers available for shaping how healthy a product appears. Understanding the common tactics will make you a more critical reader. For a broader investigation, see our hidden added sugar checklist.
Trick 1: Unrealistically small servings
Some products declare a serving far smaller than anyone would realistically eat. A well-documented example is peanut butter, where a “serving” of 15–16g (roughly one level tablespoon) is common — even though most people spread at least 32g on a slice of toast. A sweetened peanut butter with 8g sugar per serving (16g serving) has 16g sugar per realistic portion. That’s a meaningful difference when you’re watching sugar intake.
Another famous example: fizzy drink cans that label themselves “2.5 servings per container” on a standard 355ml can. The per-serving sugar count looks modest; the per-can reality is sobering.
Trick 2: Choosing favourable serving units
Thick, dense products like chocolate spread or jam can declare “one teaspoon” as a serving. One teaspoon weighs far less than one tablespoon — a fact that is obvious to a cook but not necessarily to a shopper in a rush. The per-100g figure immediately normalises this: a product with 55g sugar per 100g is 55g sugar per 100g, regardless of whether the serving is called “one teaspoon” or “a generous dollop.”
Trick 3: Inflating serving size to dilute %DV
This works in the opposite direction. By making a serving larger, manufacturers can reduce the apparent %DV per serving of nutrients like saturated fat or sodium. Ironically, some brands inflate serving sizes for nutrients they want to look positive about (e.g., protein) while keeping the same serving for other purposes. Per 100g cuts through this game entirely.
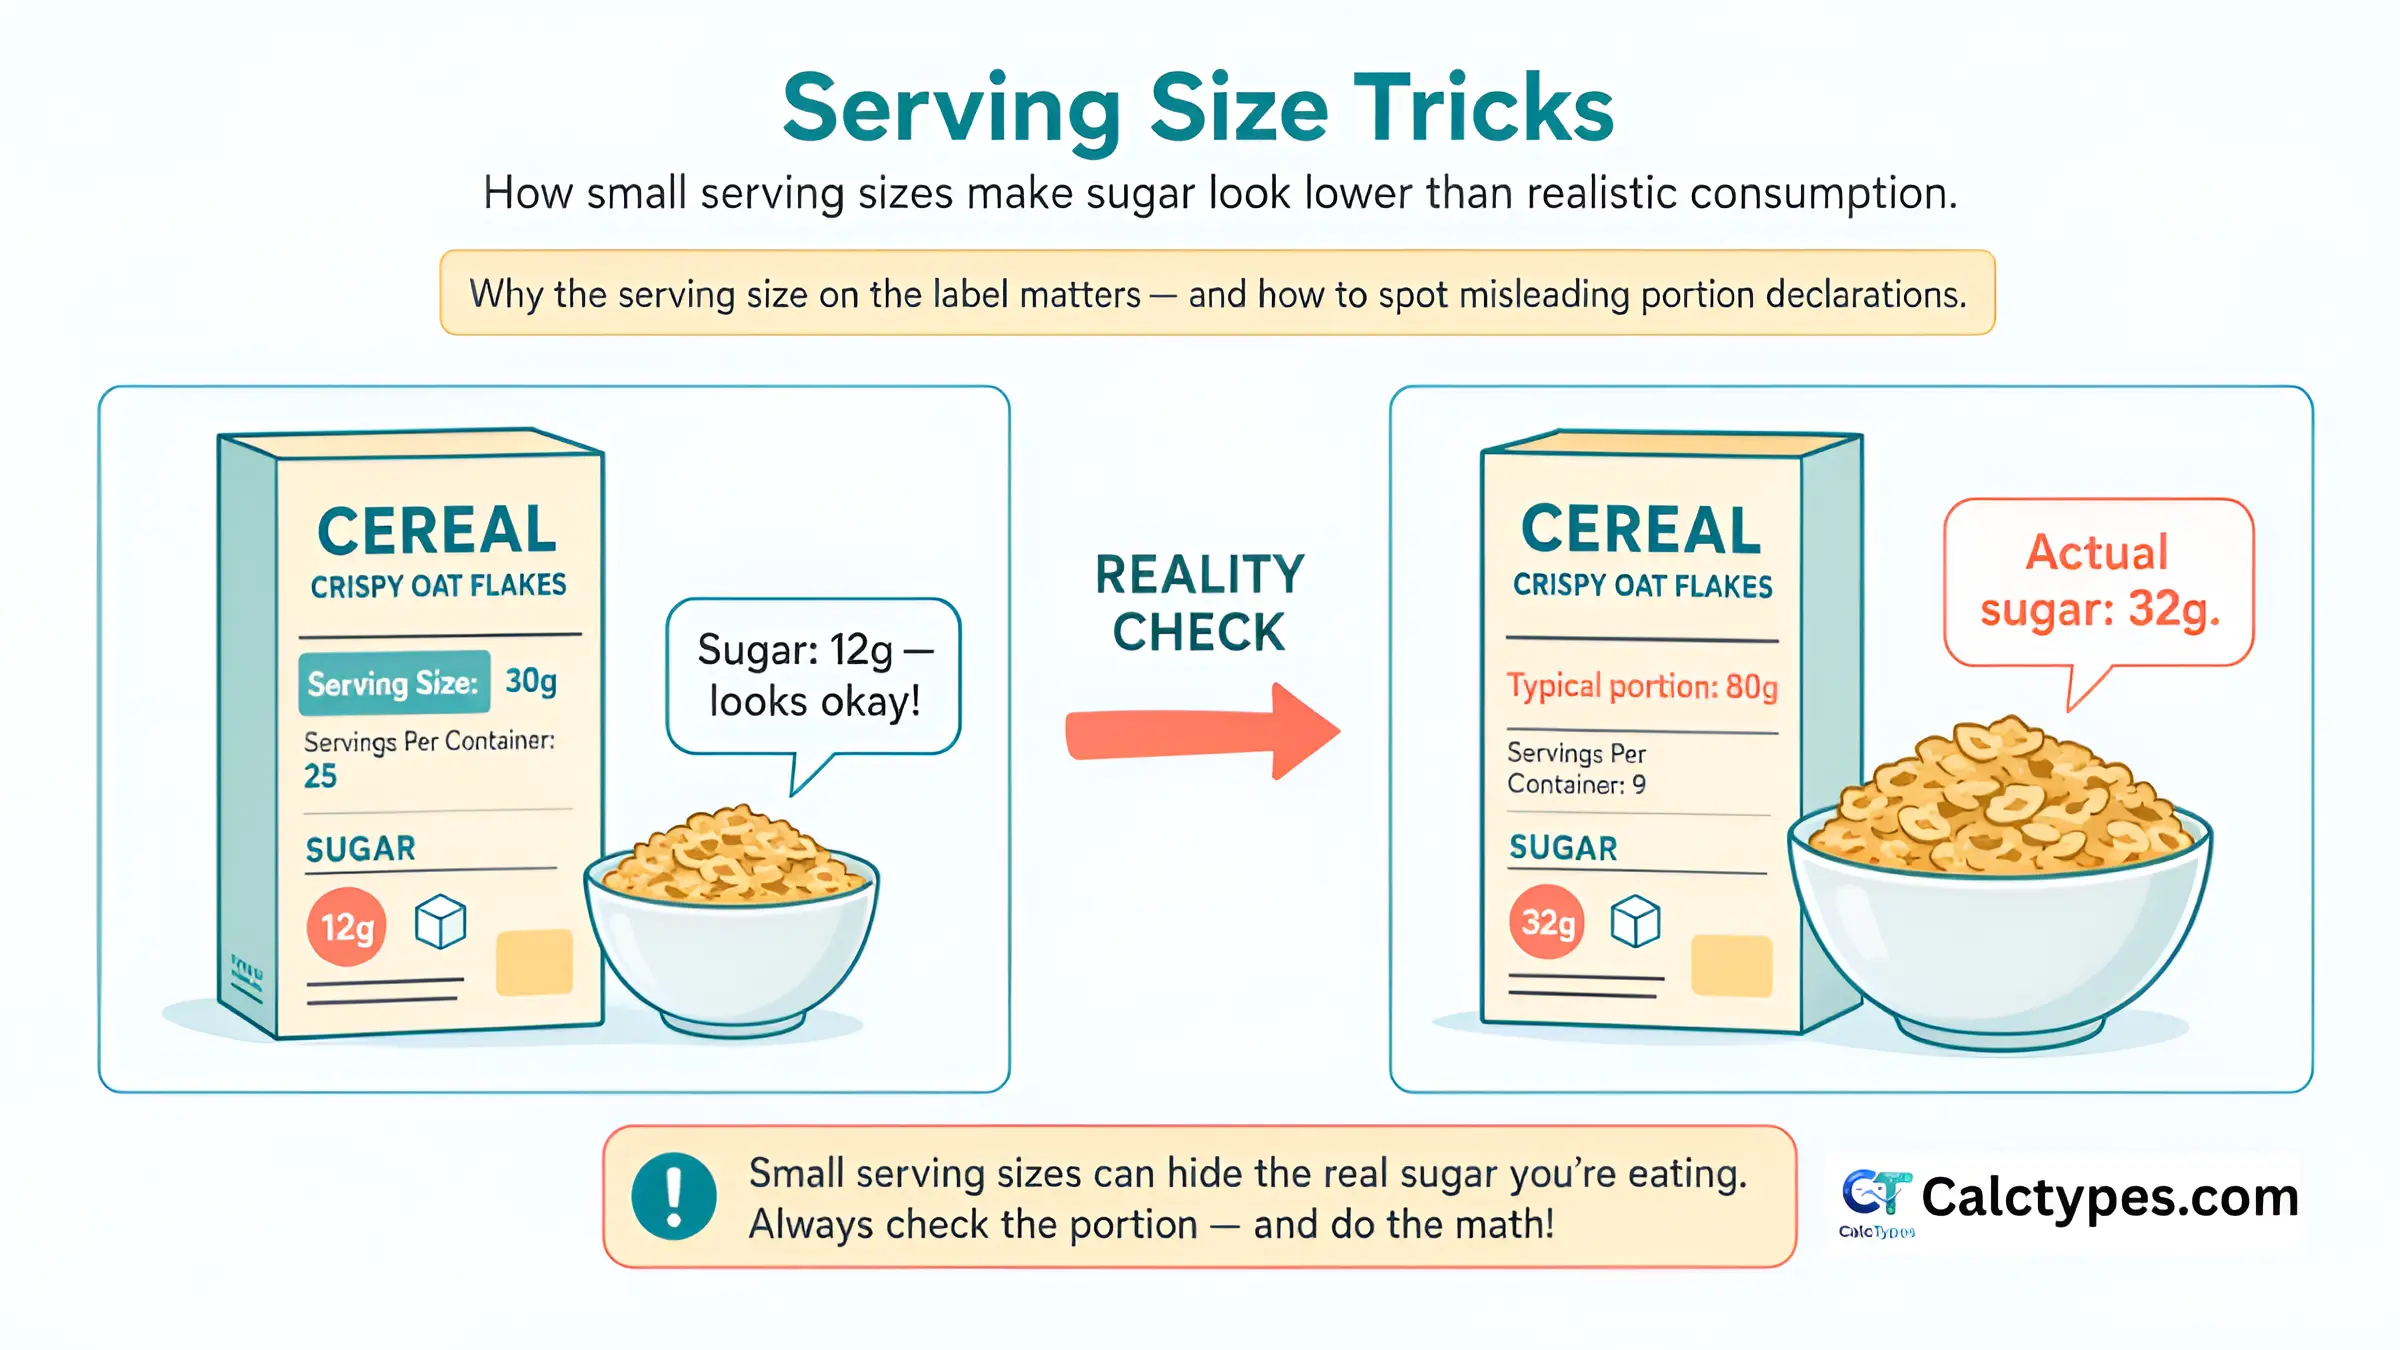
How to protect yourself from serving-size tricks
- Always check the per-100g column first when comparing products.
- Read the serving size in grams (not in spoons or cups) and compare it to what you actually eat.
- Multiply the per-serving figure by your actual portion ÷ the declared serving weight.
- Be suspicious of foods that declare very small servings (under 25g for solid foods).
- Use per-100g to rank products; then calculate your real dose from your actual portion weight.
Total Sugar vs Added Sugar on the Label
Both per-100g and per-serving figures typically refer to total sugars by default — a category that includes naturally occurring sugars (lactose in dairy, fructose in fruit) as well as added sugars (sucrose, high-fructose corn syrup, honey, agave, and hundreds of other names).
For health purposes, the distinction between total and added sugar matters significantly. A plain yogurt with 8g sugar per 100g — all from lactose — is very different from a flavoured yogurt with 8g sugar per 100g of which 6g is added sugar. The per-100g figure alone doesn’t tell you this; you need to read the added sugars sub-line on the label (mandatory in the US since 2020) or examine the ingredients list for sugar aliases. Our guide on added sugar vs total sugar covers this in depth.
| Feature | Total Sugars | Added Sugars |
|---|---|---|
| What it includes | All sugars — natural + added | Only sugars added during processing |
| Shown on label? | Yes — always | US: mandatory. UK/EU: voluntary |
| Health relevance | Useful for general comparison | Most relevant for dietary guidelines |
| Example: plain milk | 4.7g/100g (all lactose, natural) | 0g added — no health concern |
| Example: chocolate milk | 9.5g/100g | ~5g/100g added |
| WHO guideline applies to | Free sugars (added + fruit juice) | Directly relevant to free sugar limit |
When you see a product advertised as “no added sugar,” remember that its total sugar per 100g can still be high if it is made from naturally sweet ingredients like dates, raisins, or fruit concentrate. For a detailed breakdown of these label terms, see our guide on no added sugar vs unsweetened vs sugar free.
Daily Sugar Limits: Putting the Numbers in Context
Reading per-100g and per-serving figures is only useful if you have a reference point for what those numbers mean relative to a healthy daily intake.
| Authority | Recommended limit | Who it applies to | Notes |
|---|---|---|---|
| WHO (2015) | <10% total energy from free sugars; ideally <5% | All adults and children | Free sugars = added + fruit juice + honey |
| NHS (UK) | Max 30g free sugars/day (adults) | Adults 11+ | Children 7–10: max 24g; 4–6: max 19g |
| AHA (US) | Women: ≤25g; Men: ≤36g added sugar/day | Adults | Children 2–18: <25g/day |
| FDA %DV (US label) | 50g added sugars = 100% DV | Adults, 2000 kcal diet | ≤5% DV = low; ≥20% DV = high |
| EFSA (EU) | No separate added sugar DRI; recommends minimising | Adults | Focus on free sugars; align with WHO guidance |
For practical tools, visit: daily added sugar limit and added sugar intake calculator.
Step-by-Step: Comparing Two Products Using Per 100g
Here is a practical, repeatable method for comparing the sugar content of two products fairly — the kind of process a registered dietitian uses when advising clients on swapping to lower-sugar alternatives.
-
Locate the per-100g column on both labels. If one product only shows per-serving (common on US labels), use the formula: per-100g = (per-serving ÷ serving weight in g) × 100.
-
Check whether “sugars” means total or added sugars. If both labels show total sugars, the comparison is valid. If one shows total and one shows added, the comparison is incomplete — check the ingredients lists for naturally occurring sugar sources.
-
Apply the traffic light benchmark (UK system; useful internationally):
- Green (low): ≤5g sugar per 100g
- Amber (medium): 5.1–22.5g sugar per 100g
- Red (high): >22.5g sugar per 100g
-
Calculate the difference. If Product A = 18g/100g and Product B = 12g/100g, Product B has 33% less sugar per gram of food. Over a week of daily use, that difference accumulates.
-
Consider the serving size as a practical check. If Product B’s serving is 80g and Product A’s is 30g, a “normal” portion of Product B may still deliver more sugar in absolute terms despite being less sugar-dense per 100g.
Calculating Sugar for Your Actual Portion Size
The per-serving figure is useful only if you eat exactly the declared serving. Most people do not. Use this per-100g formula to estimate real intake:
The formula
Worked example:
- Chocolate granola: 28g sugar per 100g
- Your portion: 75g
- Calculation: (28 ÷ 100) × 75 = 21g sugar
- Label’s declared serving: 45g → per serving: 12.6g
- Difference: you’re consuming 67% more sugar than the label’s serving suggests
Convert grams into teaspoons: sugar grams to teaspoons.
When to weigh vs when to estimate
For everyday eating, precise weighing isn’t always practical. However, for foods you eat regularly in large quantities — breakfast cereals, granola, peanut butter, sauces, dressings — weighing your typical portion once is a genuinely useful exercise. Many people are surprised to discover how far their “natural” portions deviate from the label’s serving size.
To see how sugar in grams translates into a more intuitive measure, try our sugar grams to teaspoons converter or our sugar grams to sugar cubes visualiser — these tools make abstract gram counts feel concrete and tangible.
Understanding %DV (Percent Daily Value)
US Nutrition Facts labels include a “%DV” column alongside per-serving grams. For added sugars, the %DV is based on a daily reference of 50g.
How to read %DV for sugar
- 5% DV or less = low in added sugar (one serving contributes little)
- 10–19% DV = moderate contribution
- 20% DV or more = high — one serving provides a significant share of your daily limit
The %DV is only shown on US labels and applies to the declared serving, not 100g. If your portion differs from the serving size, your actual %DV will differ proportionally. Our %DV to grams calculator lets you convert any %DV figure into actual grams for your specific calorie intake.
Sugar Benchmarks: What Is Low, Medium, and High Per 100g?
The UK traffic light system — adopted by most major UK supermarkets and endorsed by Public Health England — provides the clearest published benchmark for per-100g sugar levels in solid foods. These thresholds are useful internationally as a general framework, even for non-UK labels.
| Sugar per 100g | Classification | Traffic light | Typical examples |
|---|---|---|---|
| ≤5g | Low | 🟢 Green | Plain yogurt, most vegetables, eggs, unsweetened oats |
| 5.1–22.5g | Medium | 🟡 Amber | Most breakfast cereals, bread, flavoured yogurt, ketchup |
| >22.5g | High | 🔴 Red | Chocolate, biscuits, jam, cola (per 100ml), most confectionery |
For liquids (per 100ml), the thresholds are the same numerically. Note that fruit juice can contain 9–11g sugar per 100ml — classified as “medium” — yet WHO and NHS guidance recommends limiting fruit juice to 150ml per day because the free sugars it contains behave similarly to added sugars metabolically.
To understand how calories from sugar relate to these figures, try our sugar calories calculator or explore what percentage of your calories comes from added sugar.
Real-world examples from common foods
| Food | Sugar per 100g | Traffic light | Notes |
|---|---|---|---|
| Plain full-fat milk | 4.7g | 🟢 Green | All lactose (natural) |
| Plain low-fat yogurt | 5.0g | 🟢 Green | Borderline; all natural lactose |
| Baked beans (no added sugar) | 4.6g | 🟢 Green | Mostly natural sugars |
| Banana (ripe) | 12g | 🟡 Amber | Natural fructose; also high fibre |
| Regular granola | 22–28g | 🟡/🔴 Amber-Red | Watch added honey/syrup |
| Cola (regular) | 10.6g/100ml | 🟡 Amber | All added sugar |
| Milk chocolate bar | 52–57g | 🔴 Red | High added sugar + fat |
| Strawberry jam | 60–65g | 🔴 Red | Concentrated added sugar |
| Honey | 80–82g | 🔴 Red | Natural but all free sugars |
| Table sugar | 100g | 🔴 Red | Pure sucrose — reference point |
Special Contexts: Children, Diabetes, and Weight Management
Children and sugar labelling
Children have lower daily energy requirements and therefore lower sugar limits in absolute terms. The NHS recommends children aged 4–6 consume no more than 19g of free sugars per day; aged 7–10, no more than 24g; and aged 11+, no more than 30g (the adult limit). A single serving of some popular children’s breakfast cereals can contain 8–12g of added sugar — that’s 42–63% of a 4-to-6-year-old’s daily limit in one bowl.
When buying foods for children, prioritise products with ≤5g total sugar per 100g (or ≤10g if the sugars are predominantly from natural dairy or wholefruit sources). Per-100g is particularly valuable for children’s food comparison because marketed “kids” versions of foods often have smaller declared servings that mask high sugar density.
Diabetes and blood glucose management
For people managing type 1 or type 2 diabetes, the per-serving figure (adjusted for actual portion) is often the most clinically relevant number because it feeds directly into carbohydrate counting and insulin dose calculation. However, the total sugars figure includes both intrinsic (slow-absorbing) and added (fast-absorbing) sugars, so knowing the breakdown matters — a food high in lactose or fibre-bound natural sugars may have a lower glycaemic impact than its total sugar count suggests.
People with diabetes should work with their care team (dietitian, diabetes nurse, or physician) to interpret food labels in the context of their overall carbohydrate targets and medication plans. This guide provides general educational information only — see our full disclaimer.
Weight management
Excess added sugar contributes to caloric surplus, and many ultra-processed foods engineered for palatability are both high in sugar and calorie-dense. For weight management, both per-100g (to identify calorie-dense, sugar-rich foods) and per-serving (to control actual intake) are useful. The most powerful approach is to use per-100g to build a mental map of which products are intrinsically high-sugar and to default to lower-sugar alternatives at the product-selection stage, before worrying about portion control.
Label Terms Decoded
Sugar-related label claims are tightly regulated in most jurisdictions, but the terminology can still be confusing. Here is a quick reference. For a deeper dive, see our guide on how to read the added sugar label.
| Label claim | What it means (regulatory) | What to check on the label |
|---|---|---|
| No added sugar | No sugar or sugar-containing ingredient added during processing | Total sugar per 100g — could still be high from natural sources |
| Sugar free | Contains <0.5g sugar per serving (US); <0.5g per 100g (EU/UK) | Check for sugar alcohols — they still add calories and affect blood glucose |
| Reduced sugar | At least 25% less sugar than the standard version | Compare per-100g to the original — 25% less may still be high |
| Unsweetened | No sweetener of any kind added | Natural sugars still present |
| Naturally sweetened | Often marketing language (not always regulated) | Check total sugars per 100g — juice concentrate/honey still count as free sugars |
| Low sugar | ≤5g sugar per 100g solid; ≤2.5g per 100ml liquid (EU/UK) | Use the per-100g column to verify |
Questions people ask
Is it better to compare sugar per 100g or per serving?
For comparing two different products, per 100g is always better because it removes the distortion caused by different serving sizes. If Product A’s serving is 20g and Product B’s serving is 80g, the per-serving figures are meaningless for comparison — you would be comparing a small portion of one food with a large portion of another. Per 100g standardises the base and gives you a true sugar-density comparison. Only switch to per-serving when you’re calculating your personal intake from a specific measured portion.
How do I calculate sugar per serving from per 100g?
The formula is straightforward: Sugar per serving = (sugar per 100g ÷ 100) × serving weight in grams. For example, if a product has 18g sugar per 100g and the serving is 40g: (18 ÷ 100) × 40 = 7.2g sugar per serving.
You can reverse this to find per 100g from per serving: per 100g = (per serving ÷ serving weight) × 100. This is particularly useful when reading US-format labels that often only show per-serving figures.
Why does the same product show different sugar values in different countries?
Serving sizes are not globally standardised. A 30g serving in the UK might be listed as a 28g serving in the US for the same product — small rounding differences that multiply across a full nutritional panel. Additionally, some products are reformulated for different markets (e.g., lower-sugar versions for European markets), so the per-100g figures may genuinely differ between country variants of a product. Always check the label on the specific package in your hand rather than relying on online databases, which may reflect a different regional formulation.
What is a healthy amount of sugar per 100g for breakfast cereal?
Most nutrition experts and public health guidelines recommend choosing breakfast cereals with no more than 10g of total sugar per 100g — ideally under 5g. Many popular cereals, especially those marketed to children, contain 25–40g sugar per 100g. A useful rule of thumb: if sugar appears in the first three ingredients on the list (which are listed by weight in most jurisdictions), the product is likely high in added sugar regardless of what the marketing claims. Plain rolled oats contain approximately 1g sugar per 100g; adding a handful of berries adds natural sugar with accompanying fibre and micronutrients — a very different nutritional package from adding a tablespoon of maple syrup.
Can a food be low in sugar per serving but high per 100g?
Yes — this is a classic label trick. If the declared serving is very small, the per-serving figure will also be small even if the product is extremely sugar-dense per 100g. Imagine a chocolate sauce with 60g sugar per 100g. A declared serving of 10g gives only 6g sugar per serving — which sounds reasonable. But if you pour 30g on your dessert (a realistic amount), you’re consuming 18g of sugar from that single condiment. Per-100g immediately flags the product as a very high-sugar food (🔴 red); per-serving at a tiny declared portion disguises this completely.
Do I need to worry about natural sugars the same way as added sugars?
For most healthy adults, naturally occurring sugars in whole foods (fructose in whole fruit, lactose in dairy) are not a health concern in the same way as added sugars. Whole fruit comes packaged with fibre, which slows glucose absorption and contributes to satiety. Dairy provides calcium, protein, and other micronutrients alongside lactose. The current scientific consensus — reflected in WHO, NHS, AHA, and FDA guidance — focuses specifically on free sugars and added sugars as the primary dietary concern, not intrinsic sugars in whole foods.
However, for people with specific conditions (e.g., irritable bowel syndrome and high-FODMAP fruit intake, or diabetes requiring careful carbohydrate management), even natural sugars may need closer monitoring. Individual clinical guidance takes precedence over general population recommendations.
Why do UK and US labels look different for sugar?
The key differences are: (1) UK/EU labels typically show per-100g and per-portion columns side by side, while US labels show only per-serving prominently. (2) UK labels often include %RI (reference intake) which is based on an adult’s typical energy needs (2000 kcal for women, aligned with EFSA guidance), while US labels show %DV (daily value) for added sugars specifically, based on 50g/day. (3) UK labels use traffic light colour coding on the front of pack (voluntary but widely adopted); US labels do not. (4) Added sugars are mandatory on US Nutrition Facts labels (since 2020); in the UK they are not separately mandatory but many manufacturers voluntarily show them.
Does the per-100g figure change if the product contains water (like canned fruit in syrup)?
Yes — significantly. When a food contains a high water content, the sugar concentration per 100g is diluted. Tinned peaches in juice might show 10g sugar per 100g — but much of that weight is water and juice. Once drained, the sugar density of the peach flesh itself is higher. Similarly, fresh fruit has lower sugar per 100g than dried fruit because drying removes water and concentrates sugars: a grape has roughly 16g sugar per 100g; a raisin has roughly 65g sugar per 100g. This is why per-100g comparisons work best within the same food state (both fresh, both dried, both canned in similar liquid).
How do I handle multi-component foods like a ready meal?
Ready meals, sandwiches, and multi-component products often show nutritional values “as prepared” (i.e., as the whole dish). In this case, the per-100g figure refers to the average sugar concentration across the whole meal as sold, and the per-serving figure refers to the entire pack (since for most ready meals, one pack = one serving). These figures can still be compared between ready meals using the per-100g column, but the comparison is less clean than with single-ingredient products because different meals have very different water and ingredient compositions. For ready meals, per-serving is often the more useful practical figure since you’re likely to eat the whole pack.
Is the per-100g figure useful for liquid foods?
For liquids, the label shows per-100ml (not per-100g, since 100ml of most beverages weighs close to 100g but not exactly). The same principles apply: per-100ml for comparison, per-serving for personal intake tracking. Drinks can be particularly deceptive because we often consume them quickly without a sense of “portion” the way we do with solid foods. A sports drink bottle might contain 500ml or 750ml — far more than the 250ml declared serving — meaning the per-serving figure understates actual sugar intake by 2–3 times. Use our sugary drinks sugar calculator to calculate total sugar for any drink size.
What does “sugars” on the label actually include?
In most regulatory frameworks, the “sugars” figure on a nutrition label refers to all monosaccharides (glucose, fructose, galactose) and disaccharides (sucrose, lactose, maltose) present in the food — from all sources, natural or added. It does not include polyols (sugar alcohols like sorbitol, xylitol, maltitol) or fibre, even though some of these may taste sweet or behave similarly to sugar in the body. Polyols are listed separately in some jurisdictions. This is why “sugar free” products sweetened with maltitol (a common polyol in chocolate alternatives) are technically sugar free on the label but still contain caloric carbohydrates with real metabolic effects.
Disclaimer
The information on this page is intended for general educational purposes only and does not constitute medical, nutritional, or clinical dietary advice. Sugar intake recommendations vary by individual health status, age, activity level, and existing conditions. The figures, benchmarks, and guidance presented reflect general population guidelines from recognised public health bodies; they are not personalised recommendations.
If you have a medical condition — including but not limited to diabetes, metabolic syndrome, cardiovascular disease, or eating disorders — or if you are managing a child’s nutrition, please consult a qualified healthcare professional or registered dietitian before making significant dietary changes based on label information. CalcTypes provides screening-level information only. Please read our full site disclaimer for further details.
Methodology
How this guide was developed
This guide was developed by cross-referencing regulatory documents from the FDA, NHS, WHO, Food Standards Agency (UK), FSANZ, and EFSA with published peer-reviewed nutrition research. Traffic light thresholds reflect Public Health England and NHS guidance (2024). Sugar benchmarks for common foods were drawn from USDA FoodData Central and the UK Nutrient Databank. Serving size regulations referenced the FDA’s 21 CFR Part 101 (Reference Amounts Customarily Consumed) and EU Regulation 1169/2011. All content was reviewed for clinical accuracy by the reviewers listed above and updated to reflect the most current publicly available guidance.